## Chart: LM Loss vs. PFLOP/s-days for MoBA and Full Attention Projections
### Overview
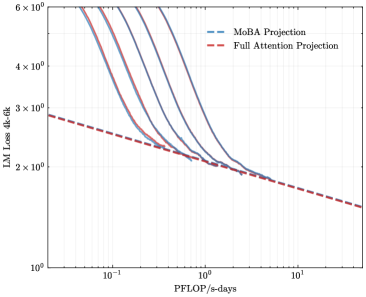
The image is a line chart comparing the Language Modeling (LM) Loss (4k-6k) against PFLOP/s-days for MoBA Projection and Full Attention Projection. The chart uses a log-log scale for both axes. The MoBA Projection is represented by multiple blue lines, while the Full Attention Projection is represented by a single red dashed line.
### Components/Axes
* **Title:** Implicitly, LM Loss vs. PFLOP/s-days
* **Y-axis:** LM Loss 4k-6k (Logarithmic scale)
* Axis Markers: 1 x 10^0, 2 x 10^0, 3 x 10^0, 4 x 10^0, 6 x 10^0
* **X-axis:** PFLOP/s-days (Logarithmic scale)
* Axis Markers: 10^-1, 10^0, 10^1
* **Legend (Top-Left):**
* MoBA Projection (Blue lines)
* Full Attention Projection (Red dashed line)
### Detailed Analysis
* **MoBA Projection (Blue lines):** There are multiple blue lines, indicating different configurations or runs of the MoBA Projection. All blue lines show a similar trend: a steep decline in LM Loss as PFLOP/s-days increases initially, followed by a more gradual decline.
* At PFLOP/s-days = 0.1, LM Loss ranges from approximately 4.5 x 10^0 to 6 x 10^0 across the different MoBA lines.
* At PFLOP/s-days = 1, LM Loss ranges from approximately 2 x 10^0 to 2.5 x 10^0.
* At PFLOP/s-days = 10, LM Loss appears to converge to approximately 1 x 10^0.
* **Full Attention Projection (Red dashed line):** The red dashed line shows a consistent downward trend.
* At PFLOP/s-days = 0.1, LM Loss is approximately 2.8 x 10^0.
* At PFLOP/s-days = 1, LM Loss is approximately 1.8 x 10^0.
* At PFLOP/s-days = 10, LM Loss is approximately 1.1 x 10^0.
### Key Observations
* The MoBA Projection lines initially show a steeper decline in LM Loss compared to the Full Attention Projection.
* The Full Attention Projection line is consistently below the MoBA Projection lines for PFLOP/s-days values greater than approximately 0.2.
* The MoBA Projection lines converge as PFLOP/s-days increases.
### Interpretation
The chart compares the performance of MoBA Projection and Full Attention Projection in terms of LM Loss as a function of computational cost (PFLOP/s-days). The data suggests that for lower computational costs (PFLOP/s-days < 0.2), MoBA Projection can achieve lower LM Loss. However, as the computational cost increases, Full Attention Projection consistently outperforms MoBA Projection, achieving lower LM Loss for the same computational cost. The convergence of the MoBA Projection lines suggests that there might be a performance limit for MoBA, while Full Attention Projection continues to improve with increasing computational resources. The multiple MoBA lines likely represent different configurations or hyperparameters, and their convergence indicates that optimizing these parameters has diminishing returns at higher computational costs.