\n
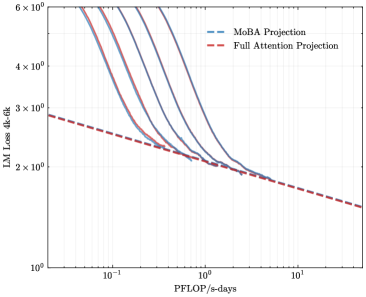
## Chart: LMi Loss vs. PFLOP/s-days
### Overview
The image presents a chart illustrating the relationship between LMi Loss (4k-6k) and PFLOP/s-days. Two projection methods, MoBA Projection and Full Attention Projection, are compared using line graphs. The chart uses a logarithmic scale for both the x and y axes.
### Components/Axes
* **X-axis:** PFLOP/s-days, ranging from approximately 10<sup>-1</sup> to 10<sup>1</sup> (logarithmic scale).
* **Y-axis:** LMi Loss (4k-6k), ranging from approximately 10<sup>0</sup> to 6 x 10<sup>6</sup> (logarithmic scale).
* **Legend:** Located in the top-right corner.
* MoBA Projection (represented by a dashed blue line)
* Full Attention Projection (represented by a dashed red line)
* **Data Series:** Two distinct lines representing the two projection methods. Multiple lines are present for the MoBA Projection, indicating different parameter sizes.
### Detailed Analysis
**Full Attention Projection (Red Dashed Line):**
The Full Attention Projection line exhibits a relatively consistent downward slope.
* At approximately 10<sup>-1</sup> PFLOP/s-days, the LMi Loss is around 5 x 10<sup>5</sup>.
* At approximately 10<sup>0</sup> PFLOP/s-days, the LMi Loss is around 2 x 10<sup>5</sup>.
* At approximately 10<sup>1</sup> PFLOP/s-days, the LMi Loss is around 5 x 10<sup>4</sup>.
**MoBA Projection (Blue Dashed Lines):**
Multiple MoBA Projection lines are present, each representing a different parameter size. All lines show a steeper downward trend compared to the Full Attention Projection.
* The uppermost MoBA Projection line (leftmost) starts at approximately 6 x 10<sup>6</sup> LMi Loss at 10<sup>-1</sup> PFLOP/s-days.
* The lines converge as PFLOP/s-days increase, with the lowest MoBA Projection line (rightmost) starting at approximately 2 x 10<sup>6</sup> LMi Loss at 10<sup>-1</sup> PFLOP/s-days.
* At approximately 10<sup>1</sup> PFLOP/s-days, the MoBA Projection lines range from approximately 1 x 10<sup>4</sup> to 2 x 10<sup>4</sup> LMi Loss.
### Key Observations
* MoBA Projection consistently outperforms Full Attention Projection in terms of LMi Loss across the entire range of PFLOP/s-days.
* The performance gap between the two methods widens as PFLOP/s-days increase.
* The multiple MoBA Projection lines suggest that performance varies with parameter size, with larger parameter sizes generally achieving lower LMi Loss.
* The logarithmic scales on both axes compress the data, making it difficult to discern precise values without further information.
### Interpretation
The chart demonstrates that MoBA Projection is more efficient than Full Attention Projection in reducing LMi Loss for a given computational cost (PFLOP/s-days). The steeper decline of the MoBA Projection lines indicates that it achieves a greater reduction in loss with increasing computational resources. The multiple MoBA Projection lines suggest a trade-off between model size (parameter count) and performance, with larger models generally performing better but requiring more computational resources. The use of logarithmic scales suggests that the relationship between LMi Loss and PFLOP/s-days is likely exponential or power-law. This type of chart is commonly used in machine learning to evaluate the efficiency and scalability of different model architectures or training techniques. The data suggests that MoBA Projection is a promising approach for improving the performance of language models, particularly in resource-constrained environments.