## Bar Chart: Distribution of Human Subjects in Validated XAI Papers
### Overview
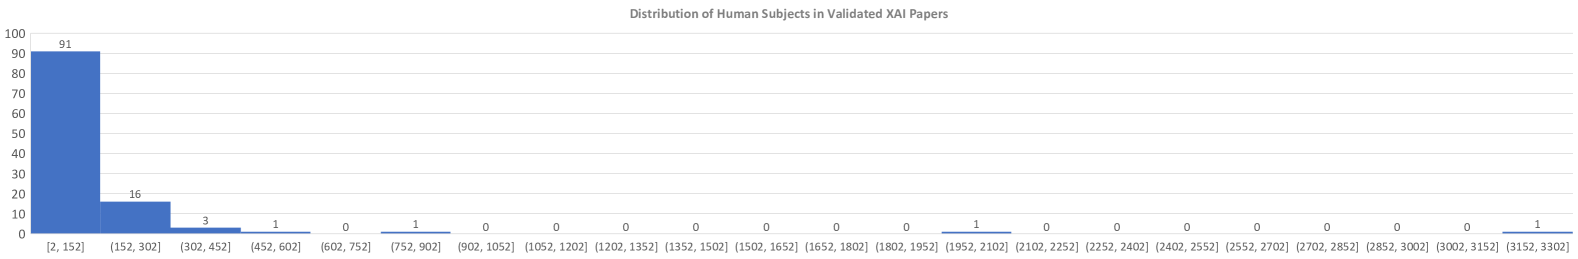
The image is a bar chart showing the distribution of the number of human subjects used in validated Explainable AI (XAI) papers. The x-axis represents the range of the number of subjects, and the y-axis represents the number of papers falling into each range.
### Components/Axes
* **Title:** Distribution of Human Subjects in Validated XAI Papers
* **X-axis:** Range of number of human subjects in intervals. The intervals are:
* \[2, 152]
* (152, 302]
* (302, 452]
* (452, 602]
* (602, 752]
* (752, 902]
* (902, 1052]
* (1052, 1202]
* (1202, 1352]
* (1352, 1502]
* (1502, 1652]
* (1652, 1802]
* (1802, 1952]
* (1952, 2102]
* (2102, 2252]
* (2252, 2402]
* (2402, 2552]
* (2552, 2702]
* (2702, 2852]
* (2852, 3002]
* (3002, 3152]
* (3152, 3302]
* **Y-axis:** Number of papers. The scale ranges from 0 to 100, with increments of 10.
### Detailed Analysis
The bar chart shows a highly skewed distribution.
* **\[2, 152]:** 91 papers
* **(152, 302]:** 16 papers
* **(302, 452]:** 3 papers
* **(452, 602]:** 1 paper
* **(602, 752]:** 0 papers
* **(752, 902]:** 1 paper
* **(902, 1052]:** 0 papers
* **(1052, 1202]:** 0 papers
* **(1202, 1352]:** 0 papers
* **(1352, 1502]:** 0 papers
* **(1502, 1652]:** 0 papers
* **(1652, 1802]:** 0 papers
* **(1802, 1952]:** 0 papers
* **(1952, 2102]:** 1 paper
* **(2102, 2252]:** 0 papers
* **(2252, 2402]:** 0 papers
* **(2402, 2552]:** 0 papers
* **(2552, 2702]:** 0 papers
* **(2702, 2852]:** 0 papers
* **(2852, 3002]:** 0 papers
* **(3002, 3152]:** 0 papers
* **(3152, 3302]:** 1 paper
### Key Observations
* The vast majority of validated XAI papers use a small number of human subjects (between 2 and 152).
* The number of papers decreases rapidly as the number of subjects increases.
* Only a few papers use a large number of human subjects (over 452).
### Interpretation
The data suggests that most XAI validation studies rely on relatively small sample sizes of human subjects. This could be due to various factors, such as the cost and difficulty of recruiting participants, the complexity of the experiments, or the specific research questions being addressed. The skewness of the distribution highlights the need for careful consideration of sample size and statistical power when designing and interpreting XAI validation studies. The presence of a few studies with very large numbers of subjects suggests that some research questions may require larger-scale data collection efforts.