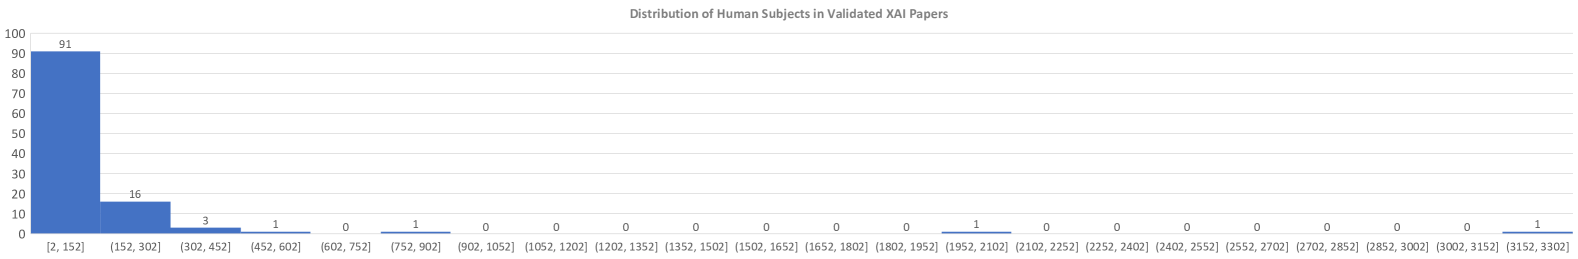
## Bar Chart: Distribution of Human Subjects in Validated KAI Papers
### Overview
This is a bar chart visualizing the distribution of human subjects across a range of validated KAI (Knowledge, Attitude, and Intention) papers. The x-axis represents the number of human subjects, grouped into bins, and the y-axis represents the frequency (percentage) of papers with that number of subjects.
### Components/Axes
* **Title:** "Distribution of Human Subjects in Validated KAI Papers" (positioned at the top-center)
* **X-axis Label:** "Number of Human Subjects" (positioned at the bottom-center)
* **Y-axis Label:** "Percentage" (positioned at the left-center)
* **Y-axis Scale:** Ranges from 0 to 100, with increments of 10.
* **X-axis Markers:** The x-axis is divided into bins representing the following ranges of human subjects:
* \[2, 152]
* \[53, 302]
* \[302, 452]
* \[452, 602]
* \[602, 752]
* \[752, 902]
* \[902, 1052]
* \[1052, 1202]
* \[1202, 1352]
* \[1352, 1502]
* \[1502, 1652]
* \[1652, 1802]
* \[1802, 1952]
* \[1952, 2102]
* \[2102, 2252]
* \[2252, 2402]
* \[2402, 2552]
* \[2552, 2702]
* \[2702, 2852]
* \[2852, 3002]
* \[3002, 3152]
* \[3152, 3302]
### Detailed Analysis
The chart shows a highly skewed distribution.
* **\[2, 152]:** The tallest bar, representing approximately 90% of the papers.
* **\[53, 302]:** The second tallest bar, representing approximately 16% of the papers.
* **\[302, 452]:** A bar representing approximately 3% of the papers.
* **\[452, 602]:** A bar representing approximately 1% of the papers.
* **\[602, 752]:** A bar representing approximately 1% of the papers.
* **\[752, 902]:** A bar representing approximately 1% of the papers.
* All other bins (\[902, 3302]) have a frequency of 0%, except for the last bin \[3152, 3302] which has a frequency of 1%.
The bars generally decrease in height as the number of human subjects increases, indicating that most papers utilize a small number of subjects.
### Key Observations
* The vast majority of validated KAI papers (approximately 90%) involve a small number of human subjects (between 2 and 152).
* There is a steep drop-off in the number of papers as the number of subjects increases.
* Only one paper (approximately 1%) includes a very large number of subjects (between 3152 and 3302).
* The distribution is heavily right-skewed.
### Interpretation
The data suggests that research in validated KAI papers tends to focus on smaller sample sizes. This could be due to several factors, including the nature of the research questions, resource constraints, or the specific populations being studied. The single outlier with a very large sample size may represent a particularly large-scale study or a meta-analysis. The concentration of studies with fewer than 152 subjects indicates a common practice of conducting focused, smaller-scale investigations within the KAI domain. This could be a characteristic of the field, or it could indicate a need for more research with larger, more representative samples to enhance the generalizability of findings.