## Bar Chart: Distribution of Human Subjects in Validated XAI Papers
### Overview
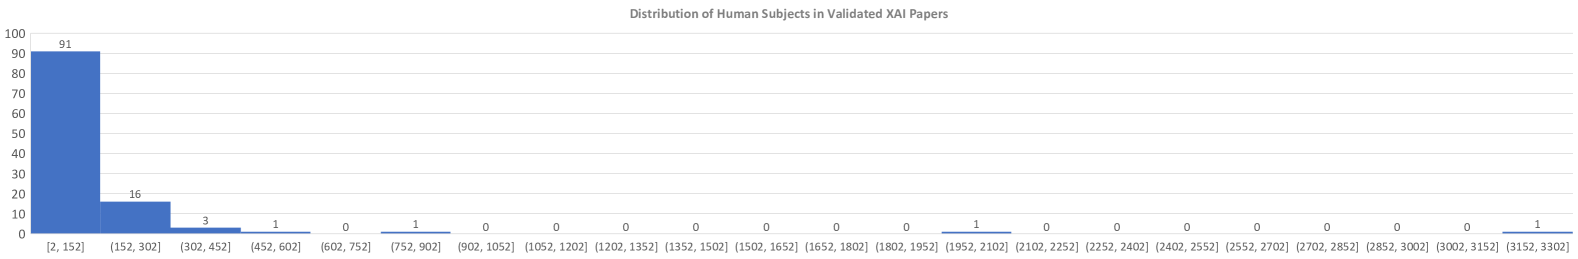
The image is a bar chart titled "Distribution of Human Subjects in Validated XAI Papers." It displays the frequency distribution of papers based on the number of human subjects used in their validation studies. The chart shows a heavily right-skewed distribution, with the vast majority of papers using a small number of subjects.
### Components/Axes
* **Chart Title:** "Distribution of Human Subjects in Validated XAI Papers" (centered at the top).
* **Y-Axis (Vertical):** Represents the count of papers. The axis is labeled with numerical markers from 0 to 100 in increments of 10 (0, 10, 20, 30, 40, 50, 60, 70, 80, 90, 100).
* **X-Axis (Horizontal):** Represents ranges (bins) for the number of human subjects. The axis is labeled with specific interval notation for each bin. The bins are, from left to right:
* `[2, 152]`
* `(152, 302]`
* `(302, 452]`
* `(452, 602]`
* `(602, 752]`
* `(752, 902]`
* `(902, 1052]`
* `(1052, 1202]`
* `(1202, 1352]`
* `(1352, 1502]`
* `(1502, 1652]`
* `(1652, 1802]`
* `(1802, 1952]`
* `(1952, 2102]`
* `(2102, 2252]`
* `(2252, 2402]`
* `(2402, 2552]`
* `(2552, 2702]`
* `(2702, 2852]`
* `(2852, 3002]`
* `(3002, 3152]`
* `(3152, 3302]`
* **Data Series:** A single series represented by blue bars. The value for each bar is annotated directly above it.
### Detailed Analysis
The chart presents the following exact data points, corresponding to the bins listed above:
1. **[2, 152]:** 91 papers
2. **(152, 302]:** 16 papers
3. **(302, 452]:** 3 papers
4. **(452, 602]:** 1 paper
5. **(602, 752]:** 0 papers
6. **(752, 902]:** 1 paper
7. **(902, 1052]:** 0 papers
8. **(1052, 1202]:** 0 papers
9. **(1202, 1352]:** 0 papers
10. **(1352, 1502]:** 0 papers
11. **(1502, 1652]:** 0 papers
12. **(1652, 1802]:** 0 papers
13. **(1802, 1952]:** 0 papers
14. **(1952, 2102]:** 1 paper
15. **(2102, 2252]:** 0 papers
16. **(2252, 2402]:** 0 papers
17. **(2402, 2552]:** 0 papers
18. **(2552, 2702]:** 0 papers
19. **(2702, 2852]:** 0 papers
20. **(2852, 3002]:** 0 papers
21. **(3002, 3152]:** 0 papers
22. **(3152, 3302]:** 1 paper
**Trend Verification:** The visual trend is a sharp, exponential-like decay. The first bar is overwhelmingly the tallest, followed by a steep drop to the second bar. The third and fourth bars are very small. The remaining bars are almost entirely flat at zero, with three isolated, single-count bars appearing at much higher ranges.
### Key Observations
1. **Dominant Bin:** The bin `[2, 152]` contains 91 out of the total 113 papers represented (approximately 80.5%).
2. **Rapid Drop-off:** There is a dramatic decrease in frequency after the first bin. Only 16 papers (≈14.2%) fall into the next bin `(152, 302]`.
3. **Long Tail with Gaps:** The distribution has an extremely long tail. After the first four bins, the counts are almost exclusively zero, with three notable exceptions: one paper in `(752, 902]`, one in `(1952, 2102]`, and one in `(3152, 3302]`.
4. **Sparse High-End Data:** The presence of single papers in bins far to the right indicates a few outlier studies with exceptionally large human subject pools, but these are very rare.
### Interpretation
This distribution suggests a strong methodological pattern in the field of Explainable AI (XAI) validation research. The data indicates that the vast majority of studies rely on relatively small-scale human subject evaluations, typically involving fewer than 152 participants. This could be due to common constraints such as cost, time, and the logistical complexity of recruiting and running human-subject experiments.
The sharp decline after the first bin implies that scaling up validation studies beyond a few hundred subjects is uncommon. The three isolated papers with very high subject counts (752-902, 1952-2102, and 3152-3302) are significant outliers. These likely represent large-scale user studies, crowdsourced experiments, or meta-analyses that aggregate data from multiple smaller studies. Their rarity highlights them as exceptional cases rather than the norm.
Overall, the chart paints a picture of a research area where validation is predominantly conducted with small to moderate sample sizes, with a few landmark studies employing much larger scales. This has implications for the generalizability and statistical power of the conclusions drawn from the majority of XAI validation papers.