# Distribution of Human Subjects in Validated XAI Papers
## Chart Description
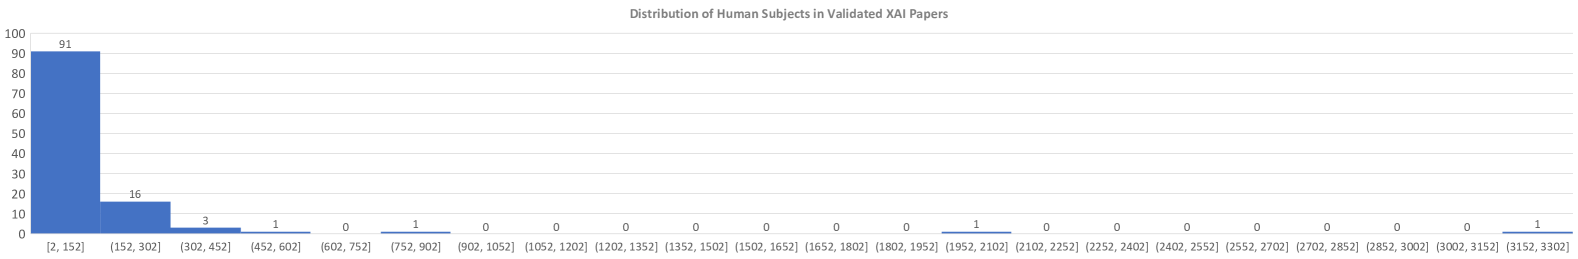
This bar chart illustrates the distribution of human subjects across validated Explainable Artificial Intelligence (XAI) papers, categorized by publication intervals. The x-axis represents time intervals (in years), while the y-axis represents the percentage of papers within each interval.
### Key Components
1. **Title**: "Distribution of Human Subjects in Validated XAI Papers"
2. **X-Axis**: Time intervals (e.g., [2, 152], (152, 302], etc.)
3. **Y-Axis**: Percentage of papers (0–100)
4. **Bars**: Blue-colored bars representing the count of papers per interval
### Data Points
| Interval | Count |
|------------------|-------|
| [2, 152] | 91 |
| (152, 302] | 16 |
| (302, 452] | 3 |
| (452, 602] | 1 |
| (602, 752] | 0 |
| (752, 902] | 1 |
| (902, 1052] | 0 |
| (1052, 1202] | 1 |
| (1202, 1352] | 0 |
| (1352, 1502] | 1 |
| (1502, 1652] | 0 |
| (1652, 1802] | 1 |
| (1802, 1952] | 0 |
| (1952, 2102] | 1 |
| (2102, 2252] | 0 |
| (2252, 2402] | 1 |
| (2402, 2552] | 0 |
| (2552, 2702] | 1 |
| (2702, 2852] | 0 |
| (2852, 3002] | 1 |
| (3002, 3152] | 0 |
| (3152, 3302] | 1 |
### Trends and Observations
1. **Dominance of Early Intervals**: The interval [2, 152] accounts for **91%** of all papers, indicating a significant concentration of research in this period.
2. **Rapid Decline**: The next interval (152, 302] shows a sharp drop to **16%**, followed by minimal activity in subsequent intervals.
3. **Sparse Distribution**: Only **5 intervals** contain non-zero values (16, 3, 1, 1, 1), with the majority of intervals (12/17) having **0 papers**.
4. **Late-Period Activity**: The final interval (3152, 3302] shows a single paper, suggesting sporadic research in recent years.
### Legend and Color Analysis
- **Legend**: No explicit legend is present in the chart. All bars are uniformly colored in **blue**, consistent with standard bar chart conventions.
### Spatial Grounding
- **Legend Placement**: Not applicable (no legend exists).
- **Bar Colors**: All bars are blue, matching the default color scheme for bar charts.
### Trend Verification
- **Primary Trend**: A steep decline from 91% to 16% between the first two intervals, followed by near-zero activity until sporadic single-paper intervals appear.
- **Secondary Trend**: A pattern of alternating zeros and ones in later intervals, indicating minimal but persistent research activity.
### Component Isolation
1. **Header**: Title and axis labels.
2. **Main Chart**: Bars representing data points.
3. **Footer**: No additional text or annotations.
### Conclusion
The chart highlights a historical concentration of XAI research in early intervals, with minimal activity in later periods. This suggests a potential gap in recent advancements or a shift in research focus.