## Data Flow Diagram: Manual Curation of Images
### Overview
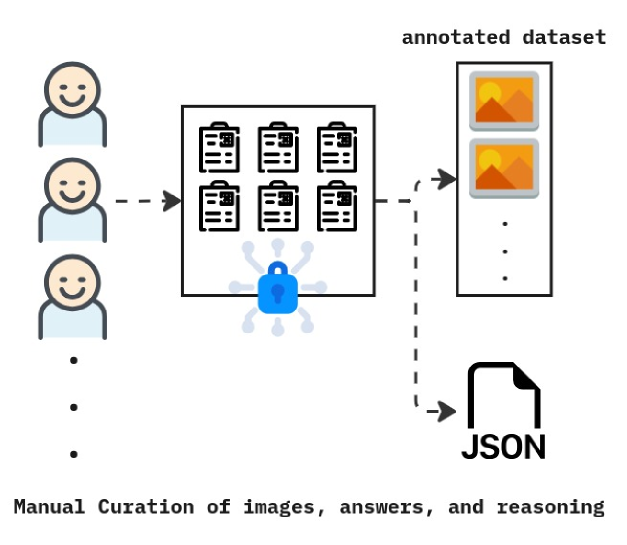
The image is a data flow diagram illustrating the process of manual curation of images, answers, and reasoning, leading to an annotated dataset and a JSON file. The diagram shows a flow from human curators to a collection of documents, then to an annotated dataset, and finally to a JSON file.
### Components/Axes
* **Actors:** Human curators (represented by three smiling face icons with an ellipsis indicating more).
* **Data Source:** A collection of documents (represented by six document icons within a square).
* **Security:** A blue padlock icon with radiating lines, indicating data security or access control.
* **Annotated Dataset:** A collection of images (represented by two image icons with an ellipsis indicating more).
* **Output:** A JSON file (represented by a file icon labeled "JSON").
* **Flow:** Dashed arrows indicate the flow of data between components.
* **Title:** "Manual Curation of images, answers, and reasoning" is located at the bottom of the diagram.
* **Label:** "annotated dataset" is located above the collection of images.
### Detailed Analysis or Content Details
1. **Human Curators:** Three smiling face icons are shown on the left, with an ellipsis below, suggesting multiple curators. A dashed arrow points from the curators to the collection of documents.
2. **Collection of Documents:** A square contains six document icons, each with horizontal lines representing text. A blue padlock icon with radiating lines is positioned below the documents, indicating security or access control.
3. **Annotated Dataset:** A dashed arrow points from the collection of documents to a vertical stack of images labeled "annotated dataset". Two images are visible, with an ellipsis below, suggesting more images.
4. **JSON File:** A dashed arrow points from the annotated dataset to a file icon labeled "JSON".
5. **Flow Direction:** The flow is from left to right, starting with human curators, moving to the collection of documents, then to the annotated dataset, and finally to the JSON file.
### Key Observations
* The diagram emphasizes the manual aspect of the curation process, with human curators as the starting point.
* The padlock icon suggests a focus on data security or access control during the curation process.
* The final output is a JSON file, which is a common format for storing structured data.
### Interpretation
The diagram illustrates a typical workflow for creating an annotated dataset. Human curators review and process a collection of documents, which are then used to create an annotated dataset of images. The final output is a JSON file, which likely contains the annotations and other metadata associated with the images. The presence of the padlock icon suggests that data security and access control are important considerations in this process. The diagram highlights the importance of manual curation in creating high-quality annotated datasets for machine learning and other applications.