## Diagram: Manual Curation Workflow
### Overview
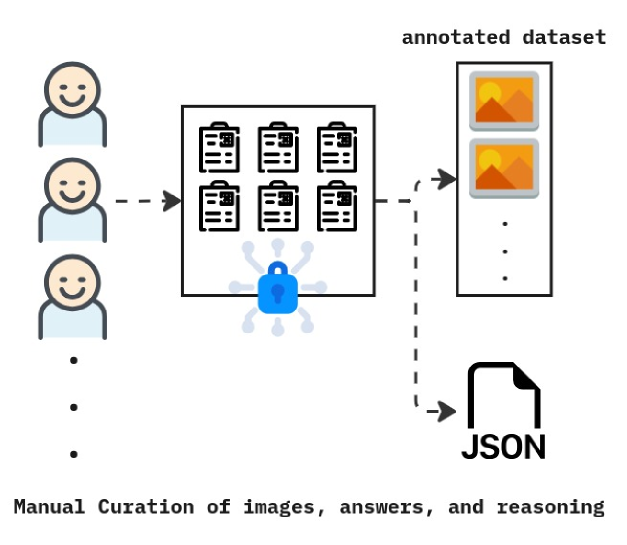
The image is a process flow diagram illustrating a "Manual Curation" pipeline. It depicts human annotators processing data through a secure environment to generate a structured, annotated dataset and corresponding JSON metadata.
### Components/Flow
The diagram is organized from left to right, representing the progression of data:
* **Left Region (Input):** A vertical stack of three human icons, with an ellipsis below, indicating a larger group of human annotators.
* **Center Region (Processing):** A square box containing six clipboard icons (representing tasks or data items). At the bottom of this box is a blue padlock icon with branching nodes, signifying a secure or private processing environment.
* **Right Region (Output):**
* **Top-Right:** A vertical rectangle containing two image icons with an ellipsis below, labeled "annotated dataset".
* **Bottom-Right:** A document icon labeled "JSON".
* **Flow Indicators:** Dashed arrows indicate the movement of data from the human annotators into the secure processing box, and then branching out to the two output formats (the dataset and the JSON file).
### Detailed Analysis
* **Textual Content:**
* "annotated dataset": Located above the image stack on the right.
* "JSON": Located below the document icon on the right.
* "Manual Curation of images, answers, and reasoning": Located at the bottom center, serving as the caption for the entire process.
* **Visual Symbols:**
* **Human Icons:** Represent the human-in-the-loop (HITL) aspect of the workflow.
* **Clipboard Icons:** Represent the individual data points or tasks being curated.
* **Padlock Icon:** A blue lock with nodes extending from it, suggesting that the curation process is encrypted, secure, or involves privacy-preserving measures.
* **Image Icons:** Represent the visual component of the dataset.
* **Document Icon:** Represents the structured text/metadata component of the dataset.
### Key Observations
* **Bifurcated Output:** The process clearly separates the visual data (images) from the structured data (JSON). This is a standard architecture for multimodal machine learning tasks, such as Visual Question Answering (VQA), where an image is paired with text-based reasoning or answers.
* **Security Emphasis:** The prominent placement of the padlock icon within the processing block suggests that the security of the curation environment is a critical feature of this workflow.
* **Scalability:** The use of ellipses under the human icons and the image icons suggests that the system is designed to handle large-scale datasets.
### Interpretation
This diagram outlines a secure, human-in-the-loop data preparation pipeline. The "Manual Curation" caption indicates that the quality of the data relies on human intelligence rather than automated labeling.
The inclusion of both an "annotated dataset" (images) and a "JSON" file suggests that the output is intended for training AI models that require paired visual and textual information. The "reasoning" mentioned in the caption implies that the JSON file likely contains not just simple labels, but complex explanations or chain-of-thought data associated with the images. The padlock icon suggests this pipeline is likely used for sensitive data, such as medical imaging, private user content, or proprietary corporate data, where data privacy and secure handling are paramount during the annotation phase.