\n
## Diagram: Data Annotation Pipeline
### Overview
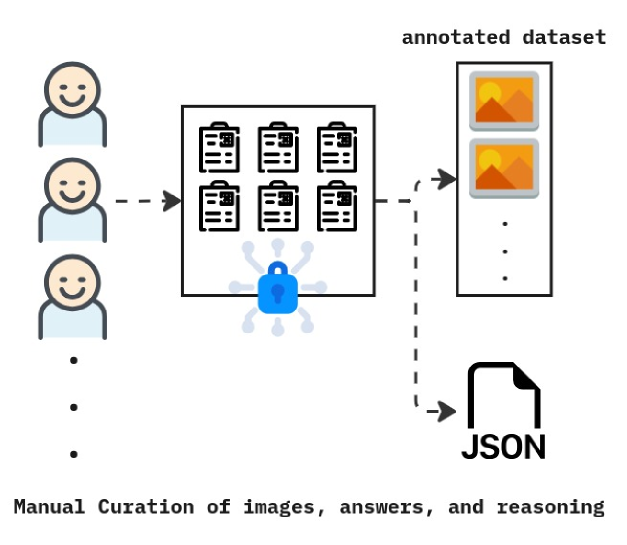
The image depicts a data annotation pipeline, illustrating the process of manual curation of images, answers, and reasoning, leading to the creation of an annotated dataset and a JSON file. The diagram shows a flow of information from human annotators to a dataset and a structured data format.
### Components/Axes
The diagram consists of the following components:
* **Human Annotators:** Represented by three smiling face icons stacked vertically on the left, with an ellipsis indicating more annotators.
* **Image Grid:** A 2x3 grid of images with a grid-like pattern within each image, positioned to the right of the annotators. A blue, cloud-like shape with lock icons is positioned in the center of the grid.
* **Annotated Dataset:** A stack of four images, visually distinct with orange and yellow tones, positioned to the right of the image grid. An ellipsis indicates that the dataset is larger than shown.
* **JSON File:** A file folder icon labeled "JSON" positioned below the annotated dataset.
* **Text Labels:**
* "annotated dataset" (above the image stack)
* "Manual Curation of images, answers, and reasoning" (below the annotators)
### Detailed Analysis / Content Details
The diagram illustrates a process flow:
1. **Input:** Multiple human annotators provide input.
2. **Processing:** The input is directed towards a grid of images. The blue cloud-like shape with lock icons suggests a security or processing step applied to the images.
3. **Output 1: Annotated Dataset:** The processed images are then used to create an annotated dataset, consisting of multiple images.
4. **Output 2: JSON File:** Simultaneously, the process also generates a JSON file, likely containing the annotations and reasoning associated with the images.
The dashed arrows indicate the flow of information. The image grid contains six images, each with a distinct grid pattern. The annotated dataset contains four images, with alternating orange and yellow tones. The JSON file is represented by a standard file folder icon.
### Key Observations
The diagram highlights the importance of manual curation in creating a high-quality annotated dataset. The inclusion of the lock icons within the blue cloud suggests a focus on data security or controlled access during the annotation process. The parallel outputs (annotated dataset and JSON file) indicate that the annotation process generates both visual data and structured data.
### Interpretation
This diagram represents a typical workflow in machine learning, specifically in the creation of training data for computer vision tasks. The manual curation step is crucial for ensuring the accuracy and reliability of the dataset. The JSON file likely stores metadata about the images, such as bounding box coordinates, object labels, or other relevant information. The security aspect (lock icons) suggests that the data may be sensitive or proprietary. The diagram emphasizes the human-in-the-loop approach to data annotation, where human expertise is used to create a high-quality dataset that can be used to train machine learning models. The diagram does not provide any quantitative data, but rather illustrates a conceptual process.