## Bar Chart: Mean Values Across Layers
### Overview
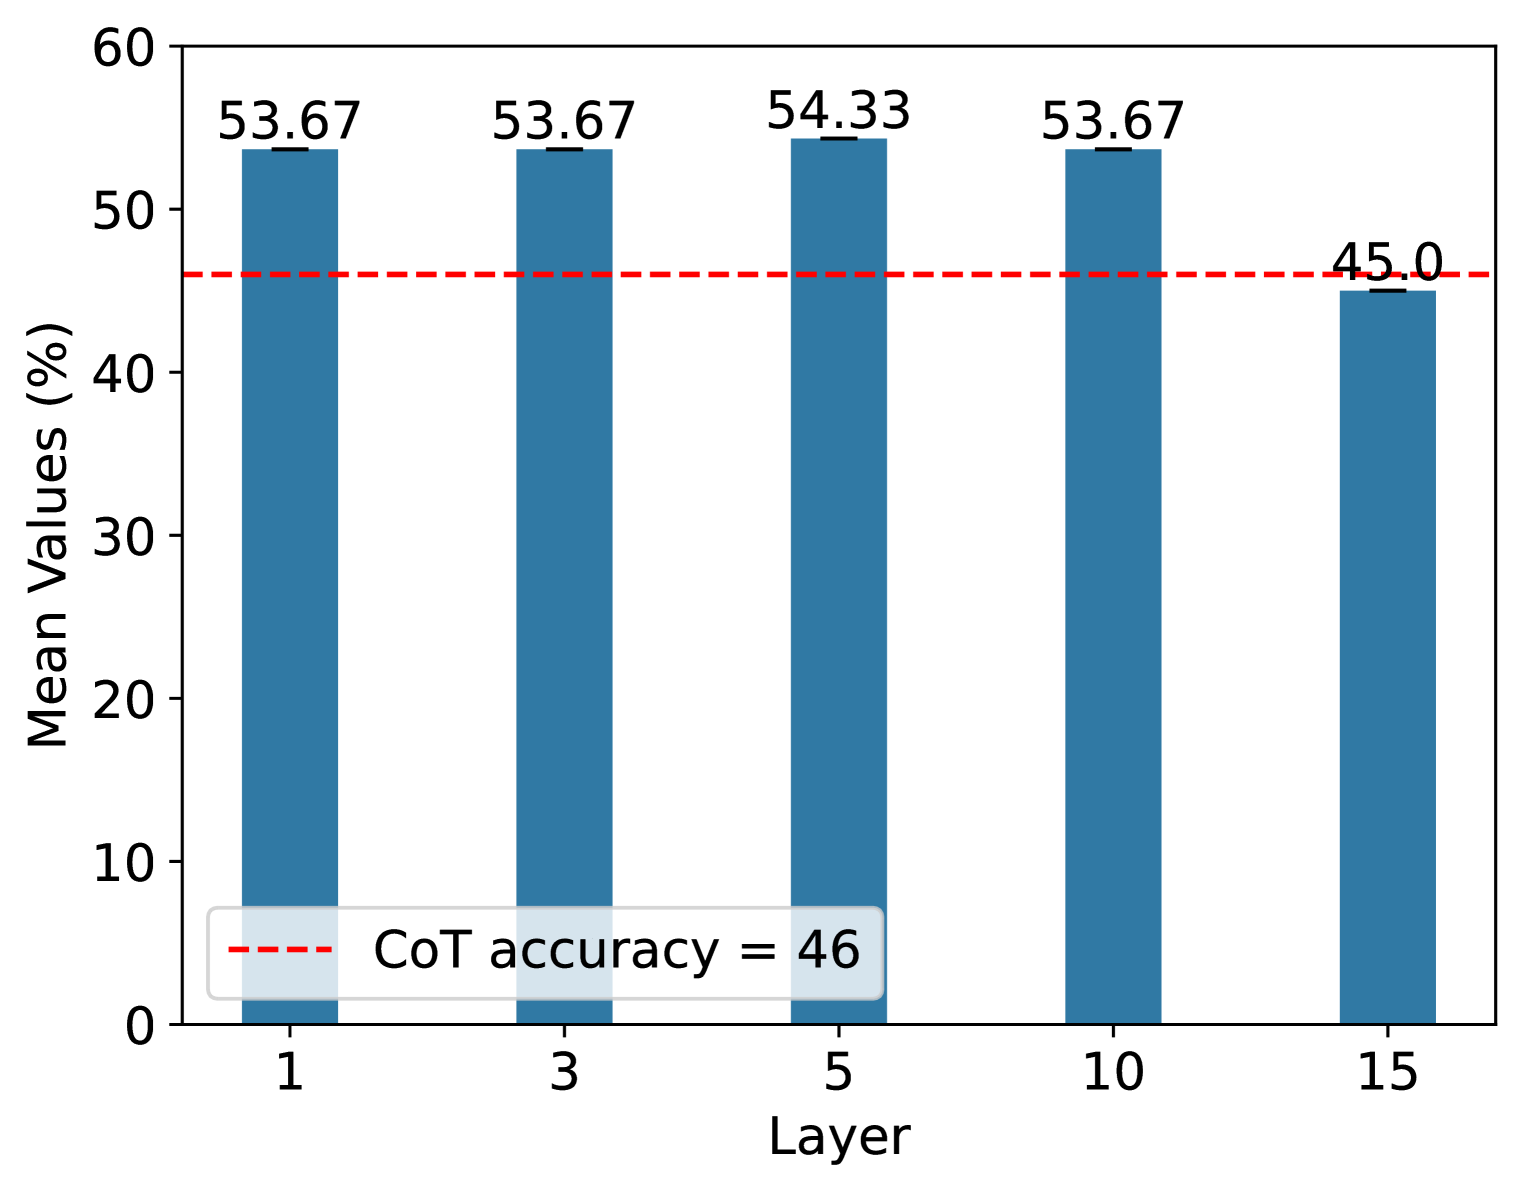
The chart displays mean values (in percentage) across five distinct layers (1, 3, 5, 10, 15). A red dashed line at 46% represents the "CoT accuracy" benchmark. Bars are colored blue, with numerical values labeled on top of each bar.
### Components/Axes
- **Y-Axis**: Labeled "Mean Values (%)" with a scale from 0 to 60 in increments of 10.
- **X-Axis**: Labeled "Layer" with discrete categories: 1, 3, 5, 10, 15.
- **Legend**: Located at the bottom-left corner, associating the red dashed line with "CoT accuracy = 46".
- **Data Series**: Single series of blue bars representing mean values for each layer.
### Detailed Analysis
- **Layer 1**: 53.67% (blue bar, top of bar labeled).
- **Layer 3**: 53.67% (blue bar, top of bar labeled).
- **Layer 5**: 54.33% (blue bar, top of bar labeled).
- **Layer 10**: 53.67% (blue bar, top of bar labeled).
- **Layer 15**: 45.0% (blue bar, top of bar labeled).
- **CoT Accuracy**: Red dashed line at 46% (matches legend label).
### Key Observations
1. **Consistency**: Layers 1, 3, and 10 share identical mean values (53.67%).
2. **Peak Performance**: Layer 5 achieves the highest mean value (54.33%).
3. **Decline at Layer 15**: The final layer (15) drops below the CoT accuracy benchmark (45.0% vs. 46%).
4. **Benchmark Comparison**: All layers except Layer 15 exceed the CoT accuracy threshold.
### Interpretation
The data suggests that layers 1–10 maintain performance above the CoT accuracy benchmark, with Layer 5 showing marginal superiority. However, Layer 15 deviates significantly, dropping below the threshold. This could indicate diminishing returns or instability in higher layers (e.g., Layer 15). The CoT accuracy line serves as a critical reference point, highlighting that most layers meet or exceed this standard, but Layer 15 fails to do so. The uniformity of Layers 1, 3, and 10 implies robustness in mid-range configurations, while Layer 5’s peak performance warrants further investigation into its unique properties.