## Line Chart: Model Performance Comparison
### Overview
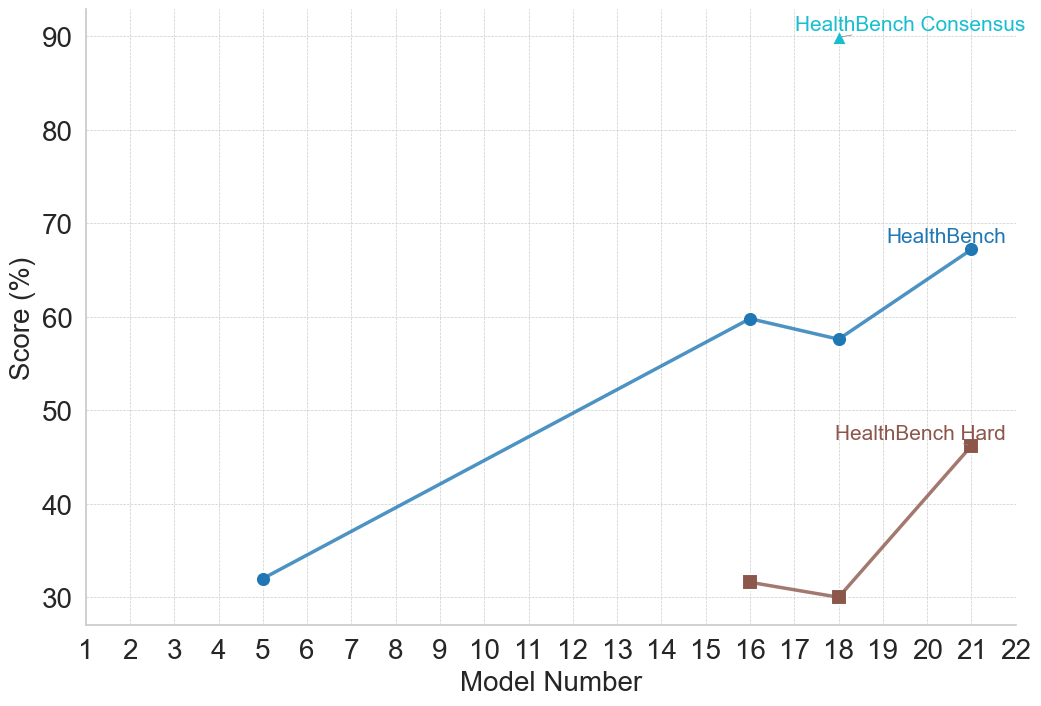
The image is a line chart comparing the performance of different models based on their "Score (%)" on the y-axis and "Model Number" on the x-axis. Three data series are plotted: "HealthBench Consensus", "HealthBench", and "HealthBench Hard".
### Components/Axes
* **X-axis:** "Model Number", ranging from 1 to 22, with integer increments.
* **Y-axis:** "Score (%)", ranging from 30 to 90, with increments of 10.
* **Legend:**
* "HealthBench Consensus" - Light Blue Triangle
* "HealthBench" - Blue Circle
* "HealthBench Hard" - Brown Square
### Detailed Analysis
* **HealthBench Consensus (Light Blue Triangle):** This series has only one data point, located at Model Number ~17, Score ~90.
* **HealthBench (Blue Circle):**
* The line starts at Model Number 5 with a score of approximately 32%.
* It increases to approximately 60% at Model Number 16.
* It dips slightly to approximately 58% at Model Number 18.
* It then rises to approximately 67% at Model Number 21.
* **HealthBench Hard (Brown Square):**
* The line starts at Model Number 16 with a score of approximately 32%.
* It decreases slightly to approximately 30% at Model Number 18.
* It then rises to approximately 47% at Model Number 21.
### Key Observations
* "HealthBench Consensus" has the highest score, but only for one model.
* "HealthBench" generally outperforms "HealthBench Hard".
* "HealthBench Hard" only has data points for the last few models.
### Interpretation
The chart compares the performance of different models using three different benchmarks: "HealthBench Consensus", "HealthBench", and "HealthBench Hard". The "HealthBench" series shows a general upward trend, indicating that later models perform better than earlier ones. The "HealthBench Hard" series shows a similar upward trend, but the scores are lower than the "HealthBench" series. The "HealthBench Consensus" series represents the highest score achieved, but it is only available for one model. This suggests that the "HealthBench Consensus" benchmark is more difficult to achieve than the other two benchmarks. The data suggests that the models are improving over time, but there is still room for improvement, especially on the "HealthBench Hard" benchmark.