\n
## Line Chart: HealthBench Performance
### Overview
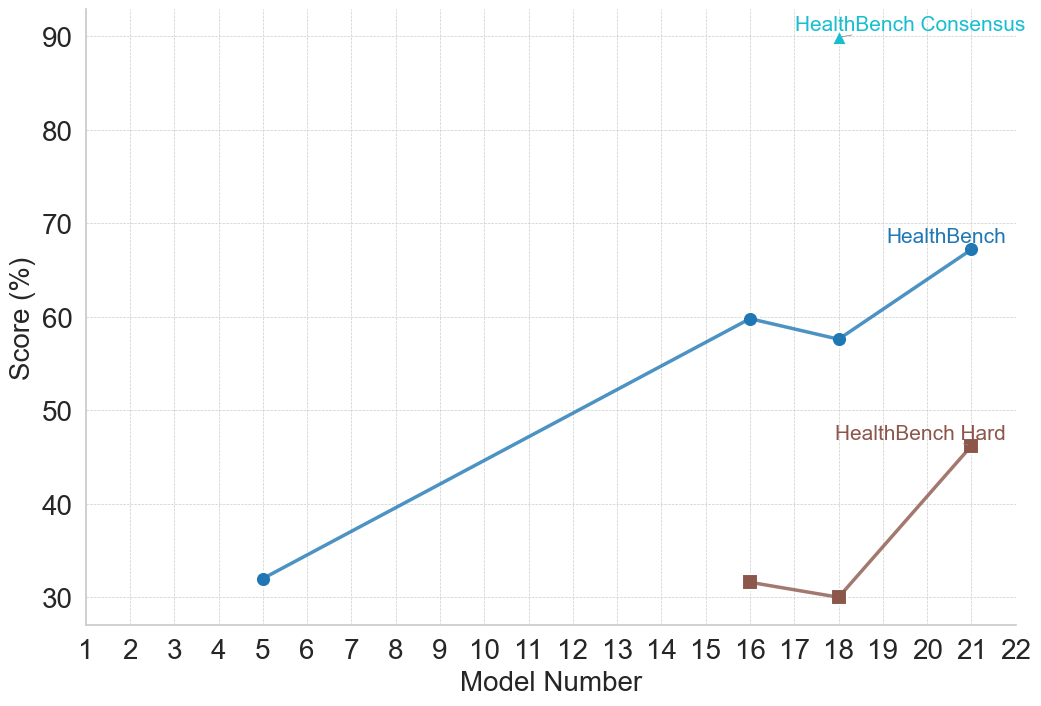
This line chart displays the performance scores of different models on the HealthBench benchmark, showing results for both a "Consensus" and "Hard" evaluation. The x-axis represents the Model Number, ranging from 1 to 22. The y-axis represents the Score, measured in percentage (%).
### Components/Axes
* **X-axis:** Model Number (1 to 22)
* **Y-axis:** Score (%) - Scale ranges from 20 to 90.
* **Data Series 1:** HealthBench Consensus - Represented by a light blue line.
* **Data Series 2:** HealthBench Hard - Represented by a grey line.
* **Legend:** Located in the top-right corner, labeling the two data series.
### Detailed Analysis
**HealthBench Consensus (Light Blue Line):**
The line generally slopes upward, indicating increasing performance with higher model numbers.
* Model 5: Approximately 32%
* Model 7: Approximately 38%
* Model 10: Approximately 45%
* Model 13: Approximately 53%
* Model 16: Approximately 60%
* Model 18: Approximately 60%
* Model 21: Approximately 64%
* Model 22: Approximately 66%
**HealthBench Hard (Grey Line):**
The line starts at a relatively low score, increases, then decreases.
* Model 5: Approximately 32%
* Model 7: Approximately 36%
* Model 10: Approximately 42%
* Model 13: Approximately 48%
* Model 16: Approximately 56%
* Model 18: Approximately 58%
* Model 19: Approximately 58%
* Model 20: Approximately 44%
* Model 21: Approximately 44%
* Model 22: Approximately 46%
### Key Observations
* Both data series start at the same score (approximately 32%) at Model 5.
* The HealthBench Consensus line shows a consistent upward trend, while the HealthBench Hard line plateaus and then declines after Model 18.
* The HealthBench Consensus consistently outperforms the HealthBench Hard evaluation, especially at higher model numbers.
* There is a significant drop in the HealthBench Hard score between Model 18 and Model 20.
### Interpretation
The chart demonstrates the performance of different models on the HealthBench benchmark under two different evaluation settings: a "Consensus" setting and a "Hard" setting. The "Consensus" setting appears to be more forgiving, as the scores consistently increase with model number. The "Hard" setting, however, shows diminishing returns and even a decline in performance for the later models. This suggests that while models may generally improve with increasing complexity, they may struggle with more challenging or nuanced aspects of the HealthBench benchmark. The divergence between the two lines indicates that the difficulty of the evaluation significantly impacts the observed performance. The drop in HealthBench Hard score after Model 18 could indicate overfitting to the consensus evaluation or a limitation in the model's ability to generalize to more difficult cases.