# Technical Document Extraction: Line Chart Analysis
## Chart Overview
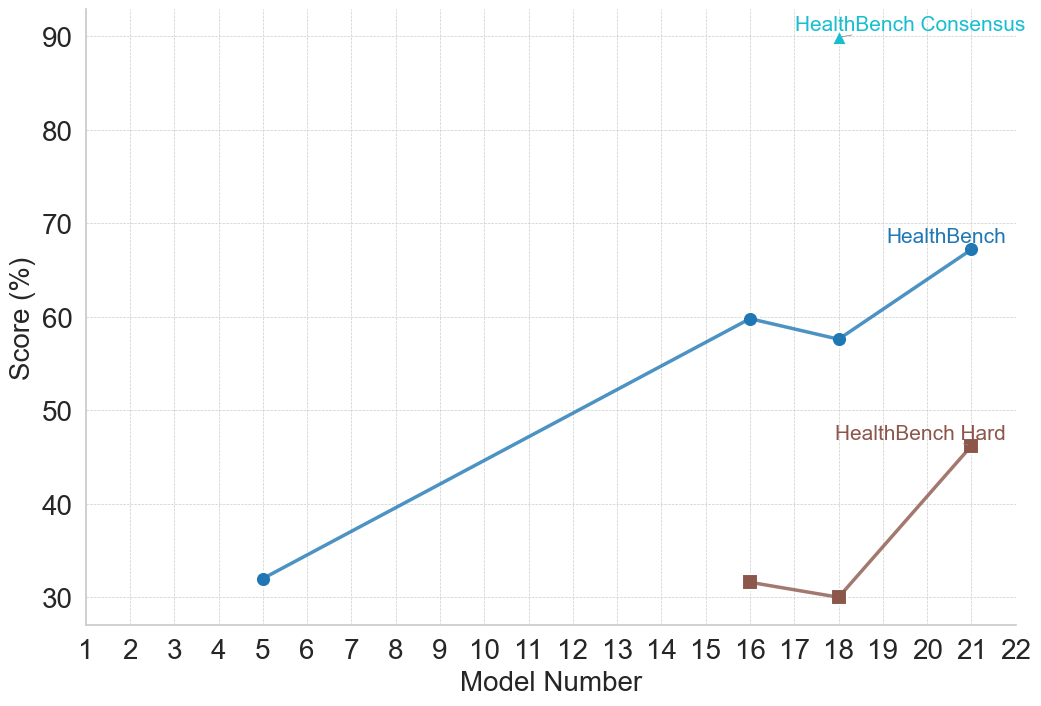
The image depicts a **line chart** with two primary data series and a consensus marker, plotted against a grid background. The chart visualizes performance scores across model numbers, with distinct trends for each series.
---
### **Axis Labels and Markers**
- **X-Axis (Horizontal):**
- Title: `Model Number`
- Range: 1 to 22 (discrete intervals)
- Tick Marks: Every integer from 1 to 22.
- **Y-Axis (Vertical):**
- Title: `Score (%)`
- Range: 30% to 90% (increments of 10%)
- Tick Marks: 30, 40, 50, 60, 70, 80, 90.
---
### **Legend**
- **Location:** Top-right corner of the chart.
- **Entries:**
1. **HealthBench** (Blue line with circular markers).
2. **HealthBench Hard** (Brown line with square markers).
---
### **Data Series and Trends**
#### 1. **HealthBench (Blue Line)**
- **Trend:**
- Starts at `(5, 32%)`, slopes upward to `(16, 60%)`, dips slightly to `(18, 58%)`, then rises sharply to `(21, 68%)`.
- **Key Data Points:**
| Model Number | Score (%) |
|--------------|-----------|
| 5 | 32 |
| 16 | 60 |
| 18 | 58 |
| 21 | 68 |
#### 2. **HealthBench Hard (Brown Line)**
- **Trend:**
- Begins at `(16, 32%)`, declines to `(18, 30%)`, then surges to `(21, 46%)`.
- **Key Data Points:**
| Model Number | Score (%) |
|--------------|-----------|
| 16 | 32 |
| 18 | 30 |
| 21 | 46 |
#### 3. **HealthBench Consensus (Annotation)**
- **Location:** `(18, 90%)` (annotated with a cyan arrow).
- **Note:** This is a standalone data point, not part of the plotted lines.
---
### **Spatial Grounding**
- **Legend Position:** Top-right quadrant (coordinates: `[x=18, y=90]` relative to the chart's grid).
- **Color Consistency:**
- Blue markers (`HealthBench`) match the blue line.
- Brown markers (`HealthBench Hard`) match the brown line.
---
### **Additional Observations**
- The chart emphasizes performance divergence between `HealthBench` and `HealthBench Hard` models, with the latter showing a late-stage improvement.
- The `HealthBench Consensus` at `(18, 90%)` suggests a benchmark or target score, though its relationship to the lines is not explicitly defined.
---
### **Conclusion**
The chart provides a comparative analysis of model performance, highlighting trends and a consensus benchmark. All textual and numerical data has been extracted and cross-referenced for accuracy.