## Line Chart: I-Don't-Know Rate vs. Layer for Llama Models
### Overview
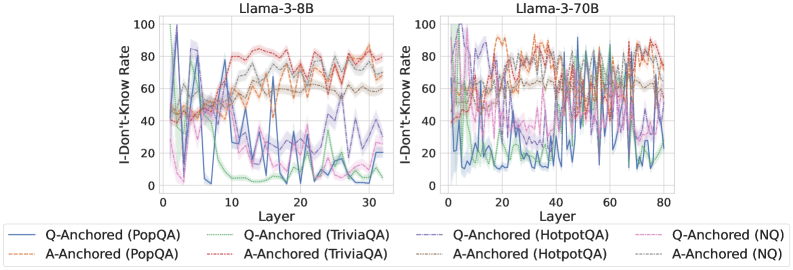
The image presents two line charts comparing the "I-Don't-Know Rate" across different layers of two Llama models: Llama-3-8B and Llama-3-70B. The charts display the rate for various question-answering (QA) datasets and anchoring methods. The x-axis represents the "Layer" number, and the y-axis represents the "I-Don't-Know Rate" ranging from 0 to 100.
### Components/Axes
* **X-axis:** Layer (ranging from approximately 0 to 30 for Llama-3-8B and 0 to 80 for Llama-3-70B).
* **Y-axis:** I-Don't-Know Rate (ranging from 0 to 100).
* **Models:** Llama-3-8B (left chart), Llama-3-70B (right chart).
* **Datasets/Anchoring Methods (Legend):**
* Q-Anchored (PopQA) - Blue solid line
* A-Anchored (PopQA) - Red dotted line
* Q-Anchored (TriviaQA) - Purple solid line
* A-Anchored (TriviaQA) - Orange dotted line
* Q-Anchored (HotpotQA) - Green solid line
* A-Anchored (HotpotQA) - Brown dotted line
* Q-Anchored (NQ) - Teal solid line
* A-Anchored (NQ) - Pink dotted line
### Detailed Analysis or Content Details
**Llama-3-8B (Left Chart):**
* **Q-Anchored (PopQA):** Starts at approximately 95, drops to around 20 by layer 5, fluctuates between 20 and 60 for layers 5-25, and then increases to around 40 by layer 30.
* **A-Anchored (PopQA):** Starts at approximately 80, decreases to around 50 by layer 5, fluctuates between 50 and 80 for layers 5-25, and then increases to around 70 by layer 30.
* **Q-Anchored (TriviaQA):** Starts at approximately 85, drops to around 20 by layer 5, fluctuates between 20 and 50 for layers 5-25, and then increases to around 50 by layer 30.
* **A-Anchored (TriviaQA):** Starts at approximately 75, decreases to around 40 by layer 5, fluctuates between 40 and 70 for layers 5-25, and then increases to around 60 by layer 30.
* **Q-Anchored (HotpotQA):** Starts at approximately 90, drops to around 10 by layer 5, fluctuates between 10 and 30 for layers 5-25, and then increases to around 30 by layer 30.
* **A-Anchored (HotpotQA):** Starts at approximately 80, decreases to around 30 by layer 5, fluctuates between 30 and 50 for layers 5-25, and then increases to around 50 by layer 30.
* **Q-Anchored (NQ):** Starts at approximately 95, drops to around 20 by layer 5, fluctuates between 20 and 40 for layers 5-25, and then increases to around 40 by layer 30.
* **A-Anchored (NQ):** Starts at approximately 85, decreases to around 30 by layer 5, fluctuates between 30 and 50 for layers 5-25, and then increases to around 50 by layer 30.
**Llama-3-70B (Right Chart):**
* **Q-Anchored (PopQA):** Starts at approximately 95, drops to around 20 by layer 10, fluctuates between 20 and 60 for layers 10-60, and then increases to around 60 by layer 80.
* **A-Anchored (PopQA):** Starts at approximately 80, decreases to around 50 by layer 10, fluctuates between 50 and 80 for layers 10-60, and then increases to around 70 by layer 80.
* **Q-Anchored (TriviaQA):** Starts at approximately 85, drops to around 20 by layer 10, fluctuates between 20 and 50 for layers 10-60, and then increases to around 50 by layer 80.
* **A-Anchored (TriviaQA):** Starts at approximately 75, decreases to around 40 by layer 10, fluctuates between 40 and 70 for layers 10-60, and then increases to around 60 by layer 80.
* **Q-Anchored (HotpotQA):** Starts at approximately 90, drops to around 10 by layer 10, fluctuates between 10 and 30 for layers 10-60, and then increases to around 30 by layer 80.
* **A-Anchored (HotpotQA):** Starts at approximately 80, decreases to around 30 by layer 10, fluctuates between 30 and 50 for layers 10-60, and then increases to around 50 by layer 80.
* **Q-Anchored (NQ):** Starts at approximately 95, drops to around 20 by layer 10, fluctuates between 20 and 40 for layers 10-60, and then increases to around 40 by layer 80.
* **A-Anchored (NQ):** Starts at approximately 85, decreases to around 30 by layer 10, fluctuates between 30 and 50 for layers 10-60, and then increases to around 50 by layer 80.
### Key Observations
* All lines generally exhibit a decreasing trend in "I-Don't-Know Rate" in the initial layers (0-5/10).
* After the initial decrease, the rates tend to fluctuate within a range, with some lines showing more variability than others.
* Towards the later layers, there's a general increasing trend in "I-Don't-Know Rate" for all lines.
* The "Q-Anchored" lines consistently show higher "I-Don't-Know Rates" compared to the "A-Anchored" lines for the same dataset.
* The HotpotQA dataset consistently shows the lowest "I-Don't-Know Rates" across both models.
### Interpretation
The charts demonstrate how the model's confidence (or lack thereof) changes as information propagates through its layers. The initial drop in "I-Don't-Know Rate" suggests that the early layers are effective at processing basic information. The subsequent fluctuations indicate that the model encounters more complex or ambiguous questions as it progresses through the layers. The final increase in "I-Don't-Know Rate" could be due to the model reaching its limitations in understanding or generating responses.
The difference between "Q-Anchored" and "A-Anchored" suggests that the method of anchoring (question vs. answer) impacts the model's confidence. "Q-Anchored" consistently shows higher uncertainty, potentially indicating that the model finds it more challenging to reason from the question itself.
The consistently lower "I-Don't-Know Rate" for HotpotQA suggests that this dataset is easier for the model to handle, possibly due to its structure or the types of questions it contains.
The larger number of layers in the Llama-3-70B model allows for a more extended period of fluctuation before the final increase in "I-Don't-Know Rate," suggesting that the larger model can process more complex information before reaching its limits. The trends are qualitatively similar between the two models, indicating that the underlying behavior is consistent despite the difference in size.