TECHNICAL ASSET FINGERPRINT
89114a391619ad3507369704
Click to view fullscreen
Press ESC or click to close
FOUND IN PAPERS
EXPERT: healer-alpha-free VERSION 1
RUNTIME: free/openrouter/healer-alpha
INTEL_VERIFIED
## Line Charts: I-Don't-Know Rate Across Model Layers for Llama-3-8B and Llama-3-70B
### Overview
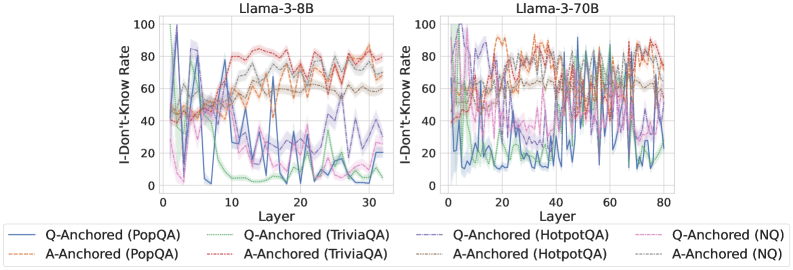
The image displays two side-by-side line charts comparing the "I-Don't-Know Rate" across the layers of two different language models: Llama-3-8B (left) and Llama-3-70B (right). Each chart plots multiple data series representing different experimental conditions, defined by an anchoring method (Q-Anchored or A-Anchored) applied to four distinct question-answering datasets (PopQA, TriviaQA, HotpotQA, NQ). The charts visualize how the model's propensity to output an "I-Don't-Know" response changes as information propagates through its internal layers.
### Components/Axes
* **Chart Titles:**
* Left Chart: `Llama-3-8B`
* Right Chart: `Llama-3-70B`
* **Y-Axis (Both Charts):**
* Label: `I-Don't-Know Rate`
* Scale: 0 to 100, with major tick marks at 0, 20, 40, 60, 80, 100.
* **X-Axis:**
* Label: `Layer`
* Left Chart Scale: 0 to 30, with major tick marks at 0, 10, 20, 30.
* Right Chart Scale: 0 to 80, with major tick marks at 0, 20, 40, 60, 80.
* **Legend (Bottom Center, spanning both charts):**
* The legend contains 8 entries, each pairing a line style/color with a condition.
* **Q-Anchored Series (Solid Lines):**
* `Q-Anchored (PopQA)`: Solid blue line.
* `Q-Anchored (TriviaQA)`: Solid green line.
* `Q-Anchored (HotpotQA)`: Solid purple line.
* `Q-Anchored (NQ)`: Solid pink line.
* **A-Anchored Series (Dashed Lines):**
* `A-Anchored (PopQA)`: Dashed orange line.
* `A-Anchored (TriviaQA)`: Dashed red line.
* `A-Anchored (HotpotQA)`: Dashed gray line.
* `A-Anchored (NQ)`: Dashed light blue line.
### Detailed Analysis
#### **Chart 1: Llama-3-8B (Left)**
* **General Trend:** The chart shows high volatility, especially in the early layers (0-10). Most lines exhibit significant fluctuations before settling into more stable trends in later layers.
* **Q-Anchored Series (Solid Lines):**
* **Q-Anchored (PopQA) - Solid Blue:** Starts very high (~100 at layer 0), drops sharply to ~20 by layer 5, and then fluctuates erratically between approximately 10 and 40 for the remaining layers.
* **Q-Anchored (TriviaQA) - Solid Green:** Begins around 60, drops to near 0 by layer 10, and remains very low (mostly below 10) for the rest of the layers.
* **Q-Anchored (HotpotQA) - Solid Purple:** Starts around 80, shows a general downward trend with high variance, ending near 20 at layer 30.
* **Q-Anchored (NQ) - Solid Pink:** Starts around 70, drops quickly, and then fluctuates in the lower range (approximately 5-30) from layer 10 onward.
* **A-Anchored Series (Dashed Lines):**
* **A-Anchored (PopQA) - Dashed Orange:** Starts around 40, rises to a plateau between 60-80, and remains relatively high and stable with minor fluctuations.
* **A-Anchored (TriviaQA) - Dashed Red:** Follows a similar pattern to A-Anchored (PopQA), starting near 40 and stabilizing in the 70-80 range.
* **A-Anchored (HotpotQA) - Dashed Gray:** Starts around 50, shows a gradual increase, and stabilizes around 60.
* **A-Anchored (NQ) - Dashed Light Blue:** Starts near 40, rises, and fluctuates in the 50-70 range.
#### **Chart 2: Llama-3-70B (Right)**
* **General Trend:** With more layers (0-80), the trends appear somewhat smoother than in the 8B model, though significant noise remains. The separation between Q-Anchored and A-Anchored series is more consistent.
* **Q-Anchored Series (Solid Lines):**
* **Q-Anchored (PopQA) - Solid Blue:** Starts high (~90), drops rapidly within the first 10 layers to ~30, and then fluctuates with a slight downward trend, ending near 20.
* **Q-Anchored (TriviaQA) - Solid Green:** Starts around 70, drops to a low level (<20) by layer 20, and remains low with minor fluctuations.
* **Q-Anchored (HotpotQA) - Solid Purple:** Starts near 80, declines steadily with noise, and settles in the 20-40 range in later layers.
* **Q-Anchored (NQ) - Solid Pink:** Starts around 60, drops to the 10-30 range by layer 20, and stays there.
* **A-Anchored Series (Dashed Lines):**
* **A-Anchored (PopQA) - Dashed Orange:** Starts around 50, climbs to a high plateau (70-90) by layer 20, and maintains that level.
* **A-Anchored (TriviaQA) - Dashed Red:** Similar to its PopQA counterpart, starting near 50 and stabilizing in the 70-90 range.
* **A-Anchored (HotpotQA) - Dashed Gray:** Starts near 50, rises to the 60-80 range, and remains stable.
* **A-Anchored (NQ) - Dashed Light Blue:** Starts around 40, increases to the 50-70 range, and fluctuates there.
### Key Observations
1. **Clear Dichotomy:** Across both models, there is a stark and consistent separation between the two anchoring methods. **A-Anchored (dashed lines)** series consistently maintain a higher "I-Don't-Know Rate" (generally 50-90) across most layers. **Q-Anchored (solid lines)** series show a pronounced drop in the early layers and maintain a much lower rate (generally 0-40) thereafter.
2. **Early-Layer Volatility:** The most dramatic changes in rate occur in the first 10-20 layers for both models, suggesting this is where the models' internal "confidence" or "knowledge routing" is most actively determined.
3. **Model Scale Effect:** The larger Llama-3-70B model exhibits slightly smoother and more sustained trends compared to the more volatile Llama-3-8B, particularly for the A-Anchored series which reach and maintain higher plateaus.
4. **Dataset Variation:** While the anchoring method is the dominant factor, dataset choice introduces secondary variation. For example, within the Q-Anchored group, the TriviaQA (green) line often drops to the lowest levels, while PopQA (blue) starts the highest.
### Interpretation
This data suggests a fundamental difference in how the two anchoring methods influence the model's internal processing. The **A-Anchored** approach appears to instill or preserve a state of high uncertainty ("I-Don't-Know") throughout the network's depth. This could be interpreted as the model maintaining a cautious, retrieval-averse, or knowledge-limited state when answers are anchored to specific answer text.
Conversely, the **Q-Anchored** approach leads to a rapid decrease in this uncertainty metric after the initial layers. This implies that anchoring to the question itself allows the model to quickly activate relevant knowledge pathways, reducing its expressed uncertainty as information flows forward. The early-layer volatility likely represents the point where the model commits to a knowledge-retrieval or response-generation strategy.
The consistency of this pattern across two model scales (8B and 70B parameters) and four diverse datasets indicates it is a robust phenomenon related to the anchoring technique itself, not an artifact of a specific model size or data domain. The charts provide strong visual evidence that the choice of anchoring point (question vs. answer) dramatically shapes the model's internal confidence dynamics.
DECODING INTELLIGENCE...