## Line Graph: I-Don't-Know Rate Across Layers for Llama-3 Models
### Overview
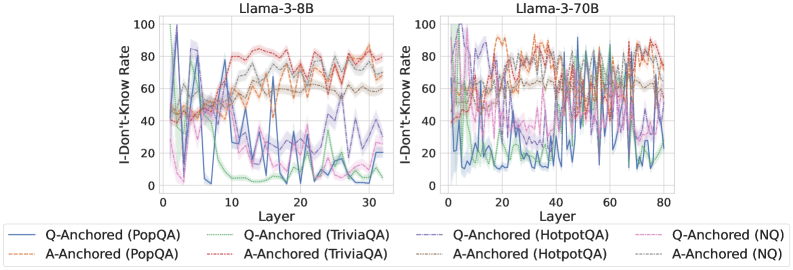
The image contains two line graphs comparing the "I-Don't-Know Rate" across transformer model layers for two versions of the Llama-3 architecture: Llama-3-8B (left) and Llama-3-70B (right). The graphs visualize performance variability across 12 datasets (e.g., PopQA, TriviaQA, HotpotQA, NQ) using Q-Anchored and A-Anchored methods. Data is represented with colored lines and shaded confidence intervals.
### Components/Axes
- **X-Axis (Horizontal)**:
- Labeled "Layer"
- Llama-3-8B: 0–30 layers
- Llama-3-70B: 0–80 layers
- **Y-Axis (Vertical)**:
- Labeled "I-Don't-Know Rate" (0–100%)
- **Legends**:
- Positioned at the bottom of both graphs
- Colors and line styles correspond to:
- **Q-Anchored (PopQA)**: Solid blue
- **A-Anchored (PopQA)**: Dashed orange
- **Q-Anchored (TriviaQA)**: Solid green
- **A-Anchored (TriviaQA)**: Dashed gray
- **Q-Anchored (HotpotQA)**: Solid purple
- **A-Anchored (HotpotQA)**: Dashed brown
- **Q-Anchored (NQ)**: Solid pink
- **A-Anchored (NQ)**: Dashed black
### Detailed Analysis
#### Llama-3-8B (Left Graph)
- **Trends**:
- Q-Anchored (PopQA, blue) shows sharp peaks (e.g., ~90% at layer 5, ~70% at layer 15).
- A-Anchored (PopQA, orange) remains relatively stable (~50–60%).
- Q-Anchored (TriviaQA, green) exhibits volatility, dropping to ~20% at layer 25.
- Q-Anchored (HotpotQA, purple) has erratic fluctuations, peaking near 80% at layer 20.
- Q-Anchored (NQ, pink) shows gradual decline from ~70% to ~30%.
#### Llama-3-70B (Right Graph)
- **Trends**:
- Q-Anchored (PopQA, blue) has extreme volatility, reaching ~100% at layer 40.
- A-Anchored (PopQA, orange) stabilizes at ~60–70%.
- Q-Anchored (TriviaQA, green) fluctuates between ~40–80%, with a notable dip at layer 60.
- Q-Anchored (HotpotQA, purple) exhibits frequent spikes (e.g., ~90% at layer 70).
- Q-Anchored (NQ, pink) declines sharply from ~80% to ~20% by layer 80.
### Key Observations
1. **Model Size Impact**: Llama-3-70B shows greater layer-to-layer variability than Llama-3-8B.
2. **Dataset Sensitivity**:
- HotpotQA (purple) demonstrates the highest instability in both models.
- NQ (pink) shows the most consistent decline in Q-Anchored configurations.
3. **Anchoring Method**: A-Anchored methods generally exhibit smoother trends compared to Q-Anchored.
4. **Layer Correlation**: No clear monotonic relationship between layer depth and I-Don't-Know Rate across datasets.
### Interpretation
The data suggests that:
- **Model Scale ≠ Performance**: Larger models (70B) exhibit higher variability in I-Don't-Know rates, potentially due to increased complexity or dataset-specific challenges.
- **Anchoring Strategy**: A-Anchored methods may reduce volatility, though this depends on the dataset (e.g., PopQA vs. HotpotQA).
- **Dataset Difficulty**: HotpotQA consistently correlates with higher uncertainty, possibly reflecting its reliance on multi-hop reasoning.
- **Layer-Specific Failures**: Peaks in Q-Anchored lines (e.g., layer 5 in Llama-3-8B) may indicate architectural bottlenecks or dataset-model mismatches.
The graphs highlight the need for dataset-specific tuning and anchoring strategies to mitigate uncertainty in large language models.