## Bar Chart: Distribution of Human Subjects in Validated XAI Papers
### Overview
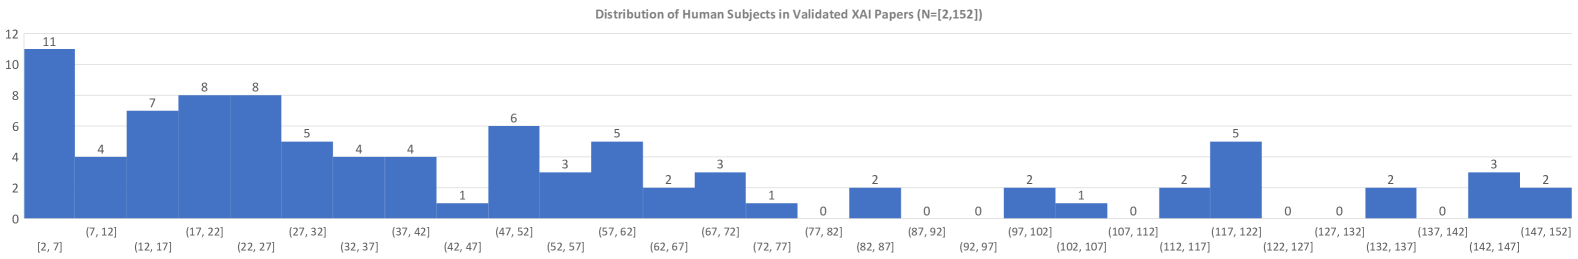
The image is a bar chart illustrating the distribution of the number of human subjects used in validated XAI (Explainable AI) papers. The x-axis represents the range of the number of subjects, and the y-axis represents the number of papers falling within each subject range. The total number of papers analyzed is N = 2,152.
### Components/Axes
* **Title:** Distribution of Human Subjects in Validated XAI Papers (N=[2,152])
* **X-axis:** Number of Human Subjects (binned into ranges)
* \[2, 7]: 11
* (7, 12]: 4
* (12, 17): 7
* (17, 22]: 8
* (22, 27]: 8
* (27, 32]: 5
* (32, 37]: 4
* (37, 42): 4
* (42, 47): 1
* (47, 52]: 6
* (52, 57]: 3
* (57, 62): 5
* (62, 67): 2
* (67, 72]: 3
* (72, 77]: 1
* (77, 82]: 0
* (82, 87]: 2
* (87, 92]: 0
* (92, 97]: 0
* (97, 102): 2
* (102, 107]: 1
* (107, 112]: 0
* (112, 117]: 2
* (117, 122]: 5
* (122, 127): 0
* (127, 132]: 0
* (132, 137]: 2
* (137, 142]: 0
* (142, 147]: 3
* (147, 152]: 2
* **Y-axis:** Number of Papers (ranging from 0 to 12)
* **Bar Color:** Blue
### Detailed Analysis
The bar chart shows the frequency of papers using a specific range of human subjects. The highest frequency is for papers using between 2 and 7 subjects (11 papers). The number of papers decreases as the number of subjects increases, with some ranges having no papers at all.
### Key Observations
* The most common range of human subjects used in validated XAI papers is between 2 and 7.
* There is a general trend of decreasing frequency as the number of subjects increases.
* Several ranges of subject counts have no corresponding papers (e.g., 77-82, 87-92, 92-97, 107-112, 122-127, 127-132, 137-142).
* There is a slight increase in the number of papers using a larger number of subjects in the range of 117-122.
### Interpretation
The data suggests that most validated XAI papers tend to use a relatively small number of human subjects. This could be due to various factors, such as the complexity of the experiments, the availability of subjects, or the specific research questions being addressed. The decreasing trend indicates that studies involving larger numbers of human subjects are less common in the field of validated XAI. The peaks at certain ranges (e.g., 117-122) might indicate specific types of studies or experimental designs that require a particular number of participants. The gaps in the distribution could be due to the nature of the research or the specific criteria used for validation.