\n
## Histogram: Distribution of Human Subjects in Validated XAI Papers
### Overview
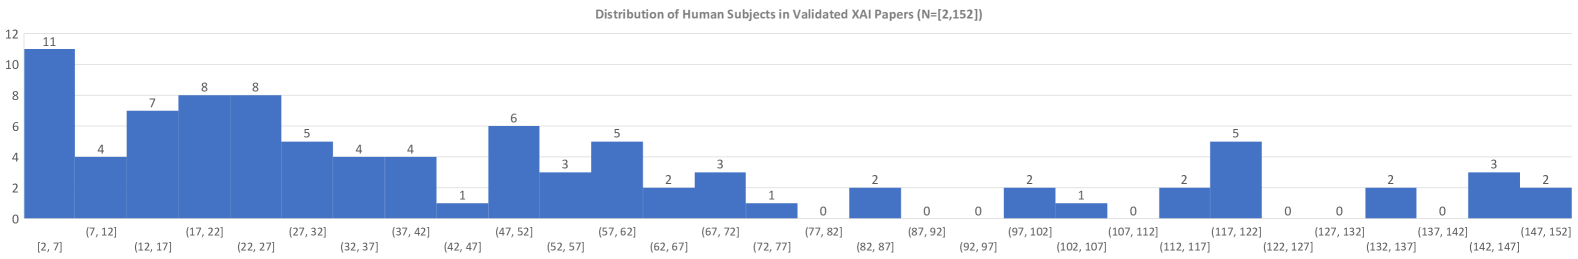
The image presents a histogram visualizing the distribution of human subjects (number of participants) across a collection of 2,152 validated Explainable Artificial Intelligence (XAI) papers. The x-axis represents the range of human subjects, grouped into bins, and the y-axis represents the frequency (count) of papers falling into each bin.
### Components/Axes
* **Title:** "Distribution of Human Subjects in Validated XAI Papers (N=2,152)" - positioned at the top-center of the image.
* **X-axis Label:** Represents the number of human subjects, divided into bins. The bins are labeled as follows: (7, 12], (12, 22], (22, 32], (32, 37], (37, 42], (42, 52], (52, 62], (62, 67], (67, 72], (72, 82], (82, 92], (92, 97], (97, 102], (102, 107], (107, 112], (112, 117], (117, 122], (122, 127], (127, 132], (132, 137], (137, 142], (142, 147], (147, 152].
* **Y-axis Label:** Represents the frequency (count) of papers. The scale ranges from 0 to 12, with increments of 2.
### Detailed Analysis
The histogram shows the following distribution of papers based on the number of human subjects:
* **(7, 12]:** 10 papers
* **(12, 22]:** 7 papers
* **(22, 32]:** 8 papers
* **(32, 37]:** 5 papers
* **(37, 42]:** 4 papers
* **(42, 52]:** 1 paper
* **(52, 62]:** 6 papers
* **(62, 67]:** 5 papers
* **(67, 72]:** 2 papers
* **(72, 82]:** 3 papers
* **(82, 92]:** 1 paper
* **(92, 97]:** 0 papers
* **(97, 102]:** 2 papers
* **(102, 107]:** 1 paper
* **(107, 112]:** 0 papers
* **(112, 117]:** 2 papers
* **(117, 122]:** 5 papers
* **(122, 127]:** 0 papers
* **(127, 132]:** 0 papers
* **(132, 137]:** 2 papers
* **(137, 142]:** 0 papers
* **(142, 147]:** 3 papers
* **(147, 152]:** 2 papers
The distribution is right-skewed. The highest frequency of papers (10) involves studies with between 7 and 12 human subjects. The frequency decreases as the number of subjects increases, with several bins having zero papers.
### Key Observations
* The most common range for the number of human subjects is between 7 and 12.
* There is a significant drop in the number of papers with more than 67 subjects.
* Several bins have a frequency of 0, indicating that no papers in the dataset used that specific range of human subjects.
* The distribution is not uniform, suggesting that researchers in the XAI field tend to favor certain sample sizes.
### Interpretation
The histogram reveals that the majority of validated XAI papers rely on relatively small sample sizes of human subjects (under 32). This could be due to several factors: the cost and difficulty of recruiting large numbers of participants for user studies, the focus of some XAI research on qualitative evaluations with fewer participants, or the nature of the XAI tasks being investigated. The right-skewed distribution suggests that while some studies do involve larger sample sizes, they are less common. The gaps in the distribution (bins with zero frequency) indicate that certain sample sizes are rarely used in XAI research. This information is valuable for understanding the methodological practices within the XAI community and for identifying potential areas for improvement in research design. The total number of papers (N=2,152) provides context for the observed frequencies, indicating that the histogram represents a substantial sample of XAI literature.