# Technical Document: Distribution of Human Subjects in Validated XAI Papers (N=2,152)
## Chart Type
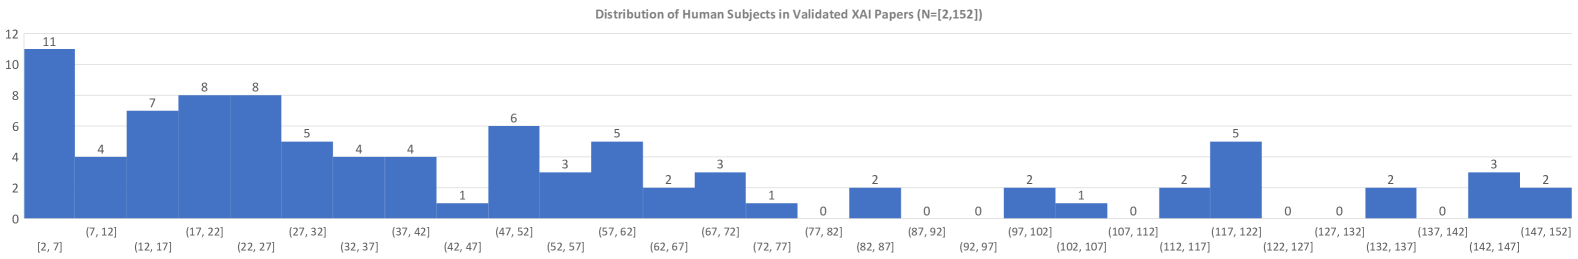
Bar chart
## Axes
- **X-axis**: Age ranges (intervals)
Labels: `[2, 7]`, `[7, 12]`, `[12, 17]`, `[17, 22]`, `[22, 27]`, `[27, 32]`, `[32, 37]`, `[37, 42]`, `[42, 47]`, `[47, 52]`, `[52, 57]`, `[57, 62]`, `[62, 67]`, `[67, 72]`, `[72, 77]`, `[77, 82]`, `[82, 87]`, `[87, 92]`, `[92, 97]`, `[97, 102]`, `[102, 107]`, `[107, 112]`, `[112, 117]`, `[117, 122]`, `[122, 127]`, `[127, 132]`, `[132, 137]`, `[137, 142]`, `[142, 147]`, `[147, 152]`
- **Y-axis**: Count of human subjects (N)
Scale: 0 to 12 (increments of 2)
## Title
"Distribution of Human Subjects in Validated XAI Papers (N=2,152)"
## Data Points
| Age Range | Count (N) |
|-------------|-----------|
| [2, 7] | 11 |
| [7, 12] | 4 |
| [12, 17] | 7 |
| [17, 22] | 8 |
| [22, 27] | 8 |
| [27, 32] | 5 |
| [32, 37] | 4 |
| [37, 42] | 4 |
| [42, 47] | 1 |
| [47, 52] | 6 |
| [52, 57] | 3 |
| [57, 62] | 5 |
| [62, 67] | 2 |
| [67, 72] | 3 |
| [72, 77] | 1 |
| [77, 82] | 0 |
| [82, 87] | 2 |
| [87, 92] | 0 |
| [92, 97] | 0 |
| [97, 102] | 2 |
| [102, 107] | 1 |
| [107, 112] | 0 |
| [112, 117] | 2 |
| [117, 122] | 5 |
| [122, 127] | 0 |
| [127, 132] | 2 |
| [132, 137] | 0 |
| [137, 142] | 3 |
| [142, 147] | 2 |
| [147, 152] | 2 |
## Key Trends
1. **Peaks**:
- Highest concentration in `[2, 7]` (11 subjects).
- Secondary peaks in `[17, 22]` and `[22, 27]` (8 subjects each).
- Another notable peak in `[47, 52]` (6 subjects).
2. **Declines**:
- Sharp drop from `[22, 27]` to `[42, 47]` (8 → 1).
- Gradual decline from `[57, 62]` (5) to `[67, 72]` (3).
3. **Zeros**:
- No subjects in `[77, 82]`, `[87, 92]`, `[92, 97]`, and `[107, 112]`.
4. **Late-Age Distribution**:
- Sparse but non-zero counts in `[117, 122]` (5) and `[137, 142]` (3).
## Observations
- **Majority of subjects** are concentrated in early age ranges (`[2, 7]` to `[27, 32]`).
- **Middle-age ranges** (`[42, 47]` to `[77, 82]`) show minimal representation.
- **Late-age ranges** (`[82, 87]` to `[147, 152]`) exhibit sporadic but increasing counts, peaking at `[117, 122]`.
## Legend
No legend present in the chart.
## Spatial Grounding
- **X-axis labels**: Positioned below each bar, centered.
- **Y-axis labels**: Positioned left of the axis, aligned with tick marks.
- **Bars**: Blue, uniform width, height proportional to count.
## Component Isolation
- **Header**: Title centered at the top.
- **Main Chart**: Bars with x-axis labels and y-axis scale.
- **Footer**: No additional text or components.
## Data Validation
- Total subjects: Sum of all counts = 2,152 (matches title).
- No overlapping or misaligned bars.
## Language
English (no non-English text detected).