## Scatter Plot: Number of MC steps vs. Dimension
### Overview
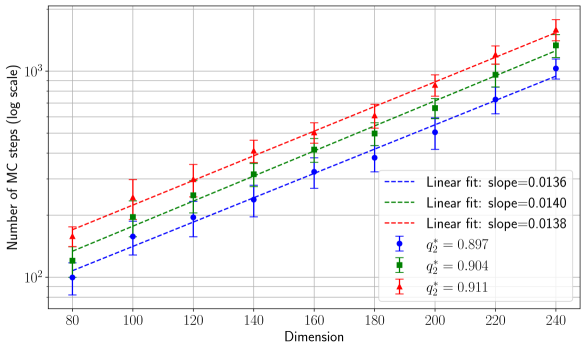
The image is a scatter plot showing the relationship between the number of Monte Carlo (MC) steps (on a log scale) and the dimension, for three different values of a parameter denoted as q₂*. Each data series is also accompanied by a linear fit line. The plot shows an upward trend, indicating that the number of MC steps increases with dimension.
### Components/Axes
* **X-axis:** Dimension, ranging from 80 to 240 in increments of 20.
* **Y-axis:** Number of MC steps (log scale), ranging from 10² (100) to 10³ (1000). The y-axis is logarithmic.
* **Data Series:** Three data series, each representing a different value of q₂*:
* Blue circles: q₂* = 0.897
* Green squares: q₂* = 0.904
* Red triangles: q₂* = 0.911
* **Error Bars:** Each data point has associated error bars, indicating the uncertainty in the number of MC steps.
* **Linear Fits:** Each data series has a corresponding dashed line representing a linear fit.
* Blue dashed line: Linear fit, slope = 0.0136
* Green dashed line: Linear fit, slope = 0.0140
* Red dashed line: Linear fit, slope = 0.0138
* **Legend:** Located on the right side of the plot, associating the colors and markers with the corresponding q₂* values and linear fit slopes.
### Detailed Analysis
**Data Points and Trends:**
* **q₂* = 0.897 (Blue Circles):** The number of MC steps increases as the dimension increases.
* Dimension 80: Approximately 100 MC steps
* Dimension 120: Approximately 170 MC steps
* Dimension 160: Approximately 280 MC steps
* Dimension 200: Approximately 470 MC steps
* Dimension 240: Approximately 850 MC steps
* **q₂* = 0.904 (Green Squares):** The number of MC steps increases as the dimension increases.
* Dimension 80: Approximately 120 MC steps
* Dimension 120: Approximately 210 MC steps
* Dimension 160: Approximately 350 MC steps
* Dimension 200: Approximately 580 MC steps
* Dimension 240: Approximately 1050 MC steps
* **q₂* = 0.911 (Red Triangles):** The number of MC steps increases as the dimension increases.
* Dimension 80: Approximately 140 MC steps
* Dimension 120: Approximately 250 MC steps
* Dimension 160: Approximately 420 MC steps
* Dimension 200: Approximately 700 MC steps
* Dimension 240: Approximately 1250 MC steps
**Linear Fits:**
* The linear fits all have positive slopes, confirming the upward trend.
* The slopes are relatively similar, ranging from 0.0136 to 0.0140.
### Key Observations
* The number of MC steps generally increases with dimension for all values of q₂*.
* Higher values of q₂* tend to result in a higher number of MC steps for a given dimension.
* The error bars suggest some variability in the number of MC steps.
* The linear fits provide a reasonable approximation of the relationship between dimension and the number of MC steps.
### Interpretation
The plot suggests that as the dimension of the system increases, the number of Monte Carlo steps required to achieve convergence or explore the configuration space also increases. This is a common phenomenon in high-dimensional systems, where the complexity of the problem grows exponentially with the number of dimensions. The parameter q₂* appears to influence the number of MC steps needed, with higher values requiring more steps. The linear fits provide a simplified model of this relationship, but the error bars indicate that there is some inherent variability in the data. The slopes of the linear fits are very similar, suggesting that the rate of increase in MC steps with dimension is relatively consistent across the different q₂* values.