## Scatter Plot with Linear Fits: Number of Monte Carlo Steps vs. Dimension
### Overview
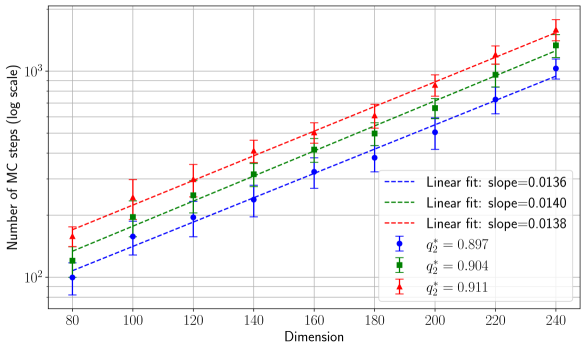
The image is a scientific scatter plot on a semi-logarithmic scale (log scale on the y-axis). It displays the relationship between the "Dimension" of a system (x-axis) and the "Number of MC (Monte Carlo) steps" required (y-axis) for three different data series. Each data series is represented by colored points with error bars and is accompanied by a dashed linear fit line. The plot includes a legend in the bottom-right quadrant.
### Components/Axes
* **X-Axis:**
* **Label:** "Dimension"
* **Scale:** Linear scale.
* **Range:** 80 to 240.
* **Major Tick Marks:** 80, 100, 120, 140, 160, 180, 200, 220, 240.
* **Y-Axis:**
* **Label:** "Number of MC steps (log scale)"
* **Scale:** Logarithmic scale (base 10).
* **Range:** Approximately 100 (10²) to over 1000 (10³).
* **Major Tick Marks:** 10², 10³.
* **Legend (Bottom-Right):**
* **Position:** Located in the lower right area of the plot, inside the axes.
* **Content:** Contains six entries, pairing line styles with data point symbols and their corresponding statistical values.
* **Entries (from top to bottom):**
1. `---` (Blue dashed line): "Linear fit: slope=0.0136"
2. `---` (Green dashed line): "Linear fit: slope=0.0140"
3. `---` (Red dashed line): "Linear fit: slope=0.0138"
4. `●` (Blue circle with error bar): "q₂² = 0.897"
5. `■` (Green square with error bar): "q₂² = 0.904"
6. `▲` (Red triangle with error bar): "q₂² = 0.911"
### Detailed Analysis
The plot shows three distinct data series, each following a clear upward trend on the semi-log plot, indicating an exponential relationship between Dimension and the Number of MC steps.
1. **Blue Series (Circle markers, `●`):**
* **Trend:** The data points follow a straight line sloping upward from left to right on the semi-log plot.
* **Linear Fit:** Represented by the blue dashed line. The legend states the slope of the fit is **0.0136**.
* **Goodness of Fit:** The coefficient of determination, q₂² (likely R²), is **0.897**.
* **Approximate Data Points (y-values are log-scale estimates):**
* Dimension 80: ~100 MC steps
* Dimension 160: ~300 MC steps
* Dimension 240: ~1000 MC steps
* **Error Bars:** Vertical error bars are present on each data point. Their size appears to increase slightly with dimension.
2. **Green Series (Square markers, `■`):**
* **Trend:** Follows a similar upward linear trend on the semi-log plot, positioned above the blue series.
* **Linear Fit:** Represented by the green dashed line. The legend states the slope is **0.0140**.
* **Goodness of Fit:** q₂² = **0.904**.
* **Approximate Data Points:**
* Dimension 80: ~120 MC steps
* Dimension 160: ~400 MC steps
* Dimension 240: ~1500 MC steps
* **Error Bars:** Vertical error bars are present, generally larger than those for the blue series at corresponding dimensions.
3. **Red Series (Triangle markers, `▲`):**
* **Trend:** Follows the highest upward linear trend on the semi-log plot.
* **Linear Fit:** Represented by the red dashed line. The legend states the slope is **0.0138**.
* **Goodness of Fit:** q₂² = **0.911**.
* **Approximate Data Points:**
* Dimension 80: ~150 MC steps
* Dimension 160: ~500 MC steps
* Dimension 240: ~2000 MC steps
* **Error Bars:** Vertical error bars are present and are the largest among the three series at each dimension.
### Key Observations
* **Consistent Scaling:** All three data series exhibit a strong linear relationship on the semi-log plot, confirming that the Number of MC steps grows exponentially with the Dimension.
* **Similar Slopes:** The fitted slopes for the three series are very close (0.0136, 0.0140, 0.0138), suggesting a similar exponential scaling factor across the different conditions (represented by the different q₂² values).
* **Hierarchy:** The series are consistently ordered: Red (highest MC steps) > Green > Blue (lowest MC steps) at every dimension point.
* **Increasing Variance:** The size of the error bars for all series tends to increase as the Dimension increases, indicating greater variability or uncertainty in the measurement at higher dimensions.
* **High Goodness of Fit:** All q₂² values are above 0.89, indicating that the linear model fits the log-transformed data very well.
### Interpretation
This chart demonstrates a fundamental scaling law in the system being studied. The exponential increase in the required Monte Carlo steps with dimension is a classic signature of the "curse of dimensionality," where computational cost grows prohibitively fast as the problem size increases.
The three series likely represent different algorithms, parameter settings, or system configurations, as indicated by their distinct q₂² values (which may be a performance or quality metric). While all configurations suffer from the same fundamental exponential scaling (similar slopes), there is a clear and consistent performance hierarchy: the configuration corresponding to the red triangles (q₂² = 0.911) requires the most computational effort (MC steps), while the blue circle configuration (q₂² = 0.897) is the most efficient. The trade-off might be that the red configuration achieves a slightly higher q₂² value. The increasing error bars suggest that predictions or measurements become less precise in higher dimensions, which is a common challenge in high-dimensional statistical analysis.