## Line Chart: Relationship Between Dimension and Number of MC Steps
### Overview
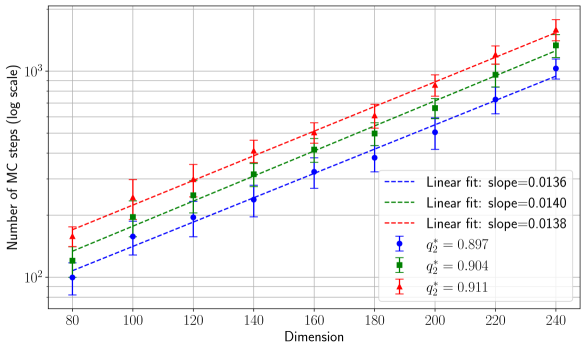
The image is a line chart depicting the relationship between "Dimension" (x-axis) and "Number of MC steps (log scale)" (y-axis). Three distinct data series are plotted, each represented by a unique line style (dashed, dash-dot, solid) and marker type (circles, squares, triangles). The y-axis uses a logarithmic scale from 10² to 10³, while the x-axis ranges from 80 to 240. A legend in the bottom-right corner identifies the three series with their slopes and q² values.
### Components/Axes
- **X-axis (Dimension)**: Labeled "Dimension," with values ranging from 80 to 240 in increments of 20.
- **Y-axis (Number of MC steps)**: Labeled "Number of MC steps (log scale)," with values from 10² to 10³ in logarithmic increments.
- **Legend**: Located in the bottom-right corner, containing three entries:
1. **Blue dashed line**: Slope = 0.0136, q² = 0.897 (circles).
2. **Green dash-dot line**: Slope = 0.0140, q² = 0.904 (squares).
3. **Red solid line**: Slope = 0.0138, q² = 0.911 (triangles).
### Detailed Analysis
- **Data Series Trends**:
- All three lines exhibit a **positive linear trend**, increasing with dimension.
- The **red solid line** (slope = 0.0138) has the steepest ascent, followed by the **green dash-dot line** (slope = 0.0140) and the **blue dashed line** (slope = 0.0136).
- Each line is accompanied by **error bars** (vertical lines with caps), indicating measurement uncertainty. The error bars grow larger at higher dimensions, suggesting increased variability in MC steps as dimension increases.
- **Logarithmic Scale**: The y-axis compresses the range of values, emphasizing proportional growth rather than absolute differences. This highlights exponential-like scaling behavior.
- **q² Values**: All q² values (0.897–0.911) are close to 1, indicating strong linear fits for the data series.
### Key Observations
1. **Consistent Growth**: All three series show a roughly linear increase in MC steps with dimension, but with slight differences in slope.
2. **Slope Variability**: The slopes (0.0136–0.0140) are very close, but the red line (0.0138) and green line (0.0140) have marginally steeper trends than the blue line (0.0136).
3. **Error Bars**: Larger error bars at higher dimensions suggest greater uncertainty in MC step measurements as systems become more complex.
4. **q² Proximity to 1**: High q² values confirm that the linear models fit the data well, with minimal deviation.
### Interpretation
The chart demonstrates that the number of Markov Chain Monte Carlo (MC) steps required scales linearly with system dimension, albeit with minor variations between the three data series. The logarithmic y-axis underscores the exponential nature of computational complexity in higher-dimensional systems. The nearly identical slopes (0.0136–0.0140) suggest a universal scaling law, while the slight differences may reflect methodological variations or system-specific factors. The high q² values (all >0.9) validate the linear models, though the error bars indicate that experimental or computational noise increases with dimension. This trend is critical for understanding computational resource requirements in high-dimensional optimization or sampling problems.