## Bar Chart: Average Time for Stages of zk Generation
### Overview
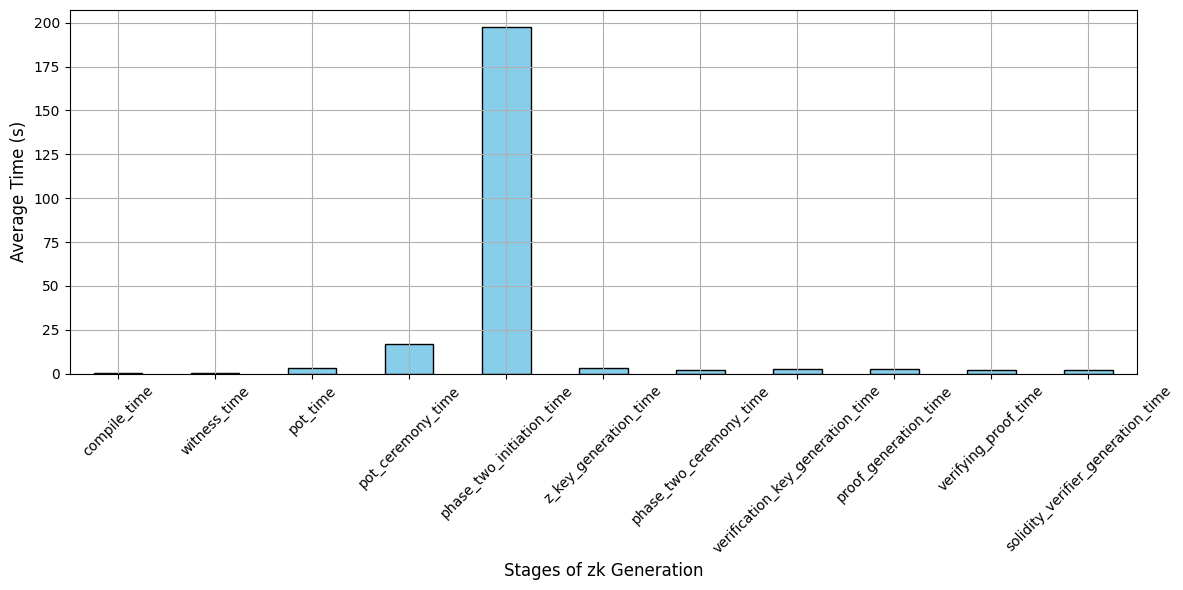
The image is a bar chart displaying the average time (in seconds) taken for different stages of zk (zero-knowledge) generation. The x-axis represents the stages, and the y-axis represents the average time. The bars are all light blue.
### Components/Axes
* **X-axis:** "Stages of zk Generation". The categories are:
* compile\_time
* witness\_time
* pot\_time
* pot\_ceremony\_time
* phase\_two\_initiation\_time
* z\_key\_generation\_time
* phase\_two\_ceremony\_time
* verification\_key\_generation\_time
* proof\_generation\_time
* verifying\_proof\_time
* solidity\_verifier\_generation\_time
* **Y-axis:** "Average Time (s)". The scale ranges from 0 to 200, with increments of 25.
### Detailed Analysis
The bar chart shows the average time for each stage of zk generation. All bars are light blue.
* **compile\_time:** Approximately 1 second.
* **witness\_time:** Approximately 1 second.
* **pot\_time:** Approximately 4 seconds.
* **pot\_ceremony\_time:** Approximately 18 seconds.
* **phase\_two\_initiation\_time:** Approximately 195 seconds.
* **z\_key\_generation\_time:** Approximately 3 seconds.
* **phase\_two\_ceremony\_time:** Approximately 2 seconds.
* **verification\_key\_generation\_time:** Approximately 3 seconds.
* **proof\_generation\_time:** Approximately 3 seconds.
* **verifying\_proof\_time:** Approximately 2 seconds.
* **solidity\_verifier\_generation\_time:** Approximately 2 seconds.
### Key Observations
The "phase\_two\_initiation\_time" stage takes significantly longer than all other stages, with an average time of approximately 195 seconds. All other stages take less than 20 seconds.
### Interpretation
The data suggests that the "phase\_two\_initiation\_time" stage is the bottleneck in the zk generation process. Optimizing this stage could significantly reduce the overall time required for zk generation. The other stages have relatively low average times, indicating they are not major contributors to the overall time.