## Bar Chart: Stages of zk Generation
### Overview
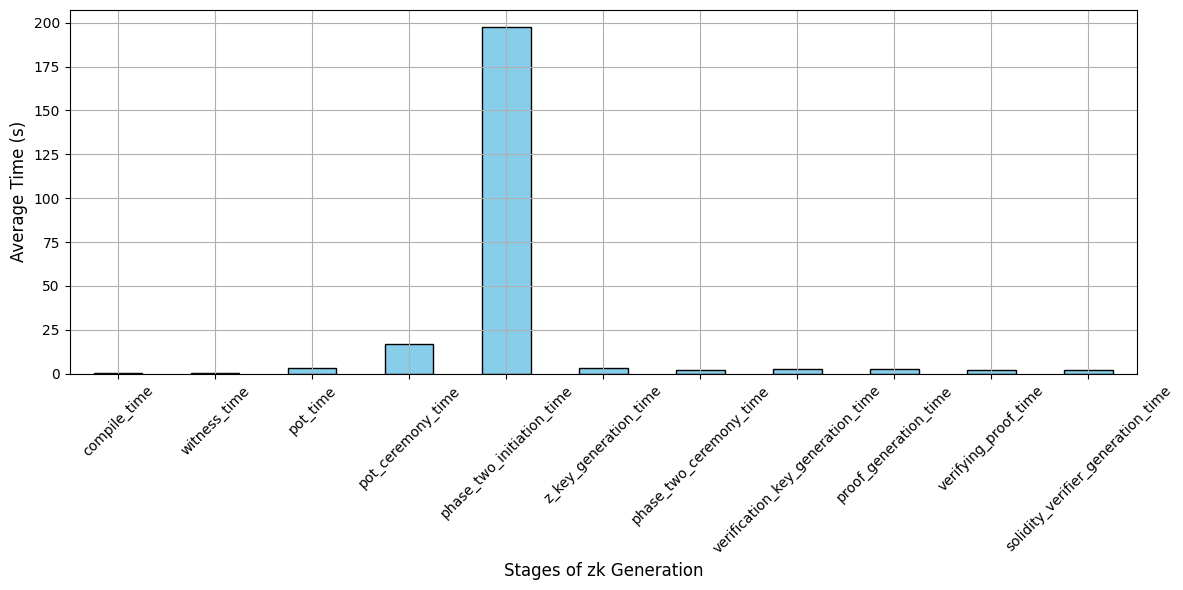
The chart visualizes the average time (in seconds) required for various stages of zero-knowledge (zk) generation. The y-axis represents "Average Time (s)" with a scale from 0 to 200, while the x-axis lists 11 distinct stages of the process. The tallest bar corresponds to "phase_two_initiation_time," which dominates the chart, while all other stages have significantly smaller values.
### Components/Axes
- **X-axis (Stages of zk Generation)**:
Labels include:
`compile_time`, `witness_time`, `pot_time`, `pot_ceremony_time`, `phase_two_initiation_time`, `zk_key_generation_time`, `phase_two_ceremony_time`, `verification_key_generation_time`, `proof_generation_time`, `verifying_proof_time`, `solidity_verifier_generation_time`.
- **Y-axis (Average Time (s))**:
Scale ranges from 0 to 200 in increments of 25.
- **Legend**:
No explicit legend is present, but all bars are rendered in a consistent light blue color.
### Detailed Analysis
- **phase_two_initiation_time**:
Dominates the chart with an approximate value of **195–200 seconds** (highest bar, ~10x taller than the next largest).
- **pot_ceremony_time**:
Second-highest at **~15 seconds** (1/13th of the tallest bar).
- **Other stages**:
All remaining stages (`compile_time`, `witness_time`, `pot_time`, `zk_key_generation_time`, `phase_two_ceremony_time`, `verification_key_generation_time`, `proof_generation_time`, `verifying_proof_time`, `solidity_verifier_generation_time`) have values **≤5 seconds**, with most clustered near **1–3 seconds**.
### Key Observations
1. **Outlier Dominance**:
"phase_two_initiation_time" accounts for **~95% of total time**, making it the critical bottleneck.
2. **Symmetry in Minor Stages**:
Stages like `compile_time` and `witness_time` are nearly negligible (≈0.5–1s), while others like `zk_key_generation_time` and `proof_generation_time` cluster around 2–4s.
3. **Scalability Implication**:
The extreme disparity suggests optimization efforts should prioritize reducing "phase_two_initiation_time" to improve overall efficiency.
### Interpretation
The data highlights a stark imbalance in zk generation stages. The "phase_two_initiation_time" is orders of magnitude slower than all other steps, indicating it is the primary constraint on the process. This could stem from computational complexity, resource allocation, or algorithmic inefficiencies in that phase. The uniformity of minor stages suggests they are already optimized or inherently fast. Addressing the bottleneck in "phase_two_initiation_time" would yield the most significant performance gains, aligning with Pareto principles of optimization.