## Diagram: State Transition and Ternary Plots
### Overview
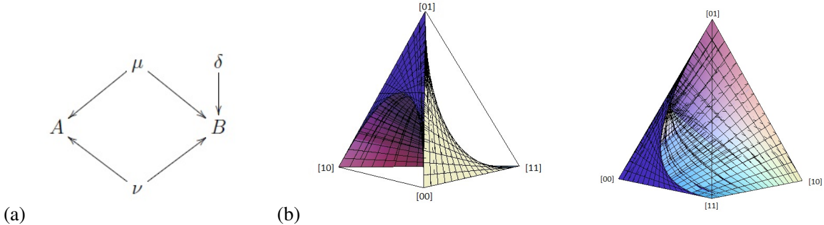
The image presents two distinct diagrams. The first (a) illustrates a state transition diagram with nodes A and B, connected by transitions labeled μ, ν, and δ. The second (b) shows two ternary plots representing some kind of state space, with vertices labeled [00], [01], [10], and [11].
### Components/Axes
#### Diagram (a): State Transition Diagram
* **Nodes:** A, B
* **Transitions:**
* A to B, labeled μ (top-right arrow)
* A to B, labeled δ (vertical arrow)
* A to B, labeled ν (bottom-right arrow)
* B to A, labeled ν (bottom-left arrow)
* B to A, labeled μ (top-left arrow)
#### Diagram (b): Ternary Plots
* **Vertices:** [00], [01], [10], [11]
* **Plot 1:** A surface is shown within the ternary plot, dividing the space. The surface appears to be curved. The surface is colored with a gradient from purple to yellow.
* **Plot 2:** A surface is shown within the ternary plot, dividing the space. The surface appears to be curved. The surface is colored with a gradient from blue to green.
### Detailed Analysis
#### Diagram (a): State Transition Diagram
The diagram depicts a system that can exist in two states, A and B. Transitions between these states are governed by parameters μ, ν, and δ. The diagram suggests a cyclical relationship between A and B, with transitions possible in both directions.
#### Diagram (b): Ternary Plots
The ternary plots visualize a state space defined by four components, represented by the vertices [00], [01], [10], and [11]. The surface within each plot divides the space into two regions, potentially representing different phases or behaviors of the system. The first plot has a surface that is colored with a gradient from purple to yellow. The second plot has a surface that is colored with a gradient from blue to green.
### Key Observations
* **Diagram (a):** The presence of both μ and ν transitions between A and B suggests a reversible process. The δ transition from A to B might represent an irreversible or direct transition.
* **Diagram (b):** The curved surfaces in the ternary plots indicate a non-linear relationship between the components. The different colors in the two plots suggest they represent different conditions or parameters.
### Interpretation
The diagrams likely represent a system with two states (A and B) and a state space defined by four components ([00], [01], [10], [11]). The state transition diagram (a) shows how the system can move between states A and B, while the ternary plots (b) visualize the composition of the system in terms of the four components. The curved surfaces in the ternary plots could represent phase boundaries or regions of stability. The two ternary plots likely represent different conditions or parameters of the system.