## Diagram and 3D Surface Plots: Mathematical Transformations and Function Visualizations
### Overview
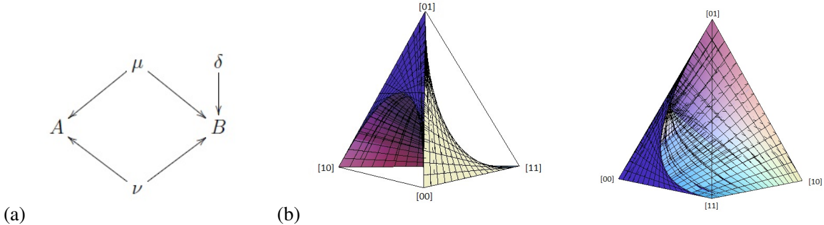
The image contains three components:
1. **(a)** A directed graph with labeled nodes and arrows.
2. **(b)** and **(c)** Two 3D surface plots with grid lines and color gradients.
### Components/Axes
#### (a) Directed Graph
- **Nodes**: Labeled `A` and `B`.
- **Arrows**:
- `μ` (mu) from `A` to `B`.
- `ν` (nu) from `B` to `A`.
- **Delta Symbol (δ)**: A downward arrow from `B` to an unlabeled node below.
#### (b) and (c) 3D Surface Plots
- **Axes**:
- **X-axis**: Labeled `[00]`, `[01]`, `[10]`, `[11]` (binary-like labels).
- **Y-axis**: Labeled `[00]`, `[01]`, `[10]`, `[11]` (same as X-axis).
- **Z-axis**: Implicitly represents the function's output (no explicit label).
- **Grid Lines**: Black grid overlaying the surfaces.
- **Color Gradients**:
- **(b)**: Purple-to-blue gradient (left plot).
- **(c)**: Rainbow gradient (purple-to-yellow) (right plot).
### Detailed Analysis
#### (a) Directed Graph
- **Flow**:
- `μ` maps `A` → `B`.
- `ν` maps `B` → `A`.
- `δ` maps `B` → (unlabeled node).
- **Interpretation**: Likely represents a transformation or mapping between sets `A` and `B`, with `δ` indicating a secondary operation or decay.
#### (b) and (c) 3D Surface Plots
- **Structure**:
- Both plots use a triangular prism-like structure with vertices at `[00]`, `[01]`, and `[11]`.
- The fourth vertex `[10]` is implied but not explicitly labeled.
- **Color Interpretation**:
- **(b)**: Purple-to-blue gradient suggests a transition from high to low values or a phase change.
- **(c)**: Rainbow gradient indicates a multi-variable function or a normalized probability distribution.
### Key Observations
1. **Symmetry in Labels**: Both 3D plots share identical axis labels (`[00]`, `[01]`, `[10]`, `[11]`), suggesting a binary or Boolean context.
2. **Color Transitions**:
- **(b)**: Sharp gradient from purple (peak) to blue (valley) implies a steep function slope.
- **(c)**: Smoother rainbow gradient suggests a more gradual variation.
3. **Missing Labels**: No explicit legend or numerical scale is provided, limiting quantitative interpretation.
### Interpretation
- **(a)** likely models a reversible transformation (`μ`/`ν`) with an irreversible component (`δ`), common in dynamical systems or state transitions.
- **(b)** and **(c)** visualize functions over a binary input space (e.g., quantum states, logic gates). The color gradients may represent:
- **(b)**: A loss function or error metric (steep decline).
- **(c)**: A probability density or activation function (smooth transition).
- **Anomalies**: The absence of a legend or numerical scale prevents precise quantification. The unlabeled node in **(a)** raises questions about the completeness of the transformation graph.
### Spatial Grounding
- **(a)**: Central placement emphasizes its role as a conceptual bridge between the two 3D plots.
- **(b)** and **(c)**: Positioned side-by-side for direct comparison of gradient behaviors.
### Content Details
- **No numerical data** or explicit units are provided.
- **Text Embedded**: Labels `A`, `B`, `μ`, `ν`, `δ`, and binary axis labels are the only textual elements.
### Final Notes
This image combines a transformation graph with function visualizations, suggesting a study of mappings and their effects on multidimensional data. Further context (e.g., equations, units) is required for rigorous analysis.