## Heatmap: Classification Accuracies
### Overview
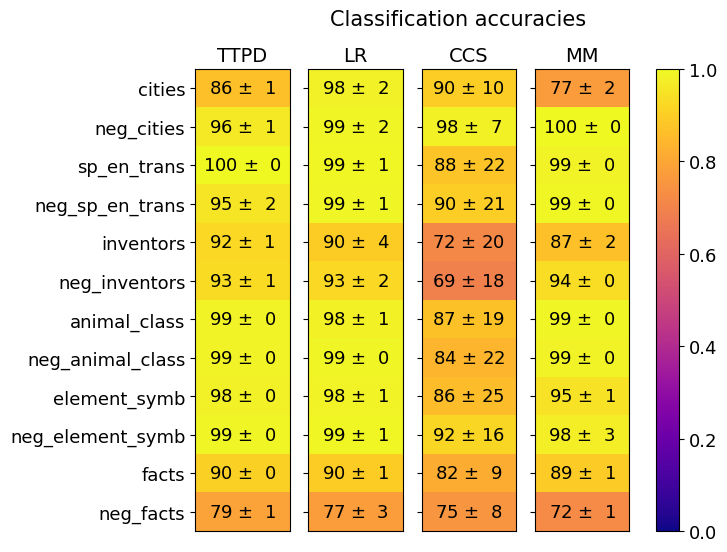
The image is a heatmap displaying classification accuracies for different models (TTPD, LR, CCS, MM) across various categories. The heatmap uses a color gradient from dark blue (0.0) to bright yellow (1.0) to represent the accuracy values. Each cell contains the accuracy value ± its standard deviation.
### Components/Axes
* **Title:** Classification accuracies
* **Columns (Models):** TTPD, LR, CCS, MM
* **Rows (Categories):** cities, neg\_cities, sp\_en\_trans, neg\_sp\_en\_trans, inventors, neg\_inventors, animal\_class, neg\_animal\_class, element\_symb, neg\_element\_symb, facts, neg\_facts
* **Colorbar:** Ranges from 0.0 (dark blue) to 1.0 (bright yellow), representing classification accuracy.
### Detailed Analysis
The heatmap presents classification accuracies for four different models (TTPD, LR, CCS, and MM) across twelve categories. Each cell in the heatmap displays the accuracy value along with its standard deviation. The color of each cell corresponds to the accuracy value, with yellow indicating high accuracy and blue indicating low accuracy.
Here's a breakdown of the data:
* **cities:**
* TTPD: 86 ± 1
* LR: 98 ± 2
* CCS: 90 ± 10
* MM: 77 ± 2
* **neg\_cities:**
* TTPD: 96 ± 1
* LR: 99 ± 2
* CCS: 98 ± 7
* MM: 100 ± 0
* **sp\_en\_trans:**
* TTPD: 100 ± 0
* LR: 99 ± 1
* CCS: 88 ± 22
* MM: 99 ± 0
* **neg\_sp\_en\_trans:**
* TTPD: 95 ± 2
* LR: 99 ± 1
* CCS: 90 ± 21
* MM: 99 ± 0
* **inventors:**
* TTPD: 92 ± 1
* LR: 90 ± 4
* CCS: 72 ± 20
* MM: 87 ± 2
* **neg\_inventors:**
* TTPD: 93 ± 1
* LR: 93 ± 2
* CCS: 69 ± 18
* MM: 94 ± 0
* **animal\_class:**
* TTPD: 99 ± 0
* LR: 98 ± 1
* CCS: 87 ± 19
* MM: 99 ± 0
* **neg\_animal\_class:**
* TTPD: 99 ± 0
* LR: 99 ± 0
* CCS: 84 ± 22
* MM: 99 ± 0
* **element\_symb:**
* TTPD: 98 ± 0
* LR: 98 ± 1
* CCS: 86 ± 25
* MM: 95 ± 1
* **neg\_element\_symb:**
* TTPD: 99 ± 0
* LR: 99 ± 1
* CCS: 92 ± 16
* MM: 98 ± 3
* **facts:**
* TTPD: 90 ± 0
* LR: 90 ± 1
* CCS: 82 ± 9
* MM: 89 ± 1
* **neg\_facts:**
* TTPD: 79 ± 1
* LR: 77 ± 3
* CCS: 75 ± 8
* MM: 72 ± 1
### Key Observations
* The LR model generally shows high accuracy across all categories.
* The CCS model has lower accuracy and higher standard deviation in several categories (inventors, neg\_inventors, animal\_class, neg\_animal\_class, element\_symb).
* The MM model achieves perfect accuracy (100 ± 0) for the 'neg\_cities' category.
* The 'neg\_facts' category has the lowest accuracies across all models compared to other categories.
### Interpretation
The heatmap provides a visual comparison of the classification accuracies of four different models across twelve categories. The LR model appears to be the most consistent performer, achieving high accuracy across all categories. The CCS model shows more variability in its performance, with lower accuracy and higher standard deviation in several categories, suggesting it may be less robust or more sensitive to the specific characteristics of those categories. The MM model performs well, with a perfect score in one category. The 'neg\_facts' category seems to be the most challenging for all models, indicating that it may be inherently more difficult to classify correctly. The standard deviations provide insight into the stability and reliability of each model's performance.