## Heatmap: Classification Accuracies
### Overview
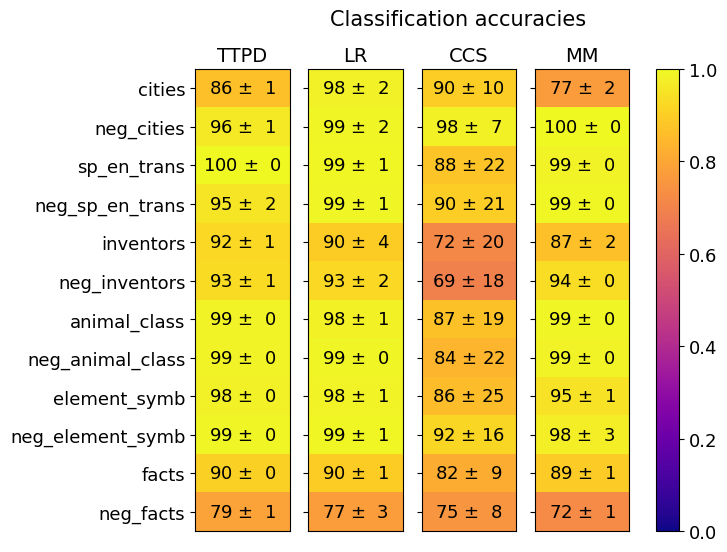
The image is a heatmap visualizing classification accuracy across four machine learning models (TTPD, LR, CCS, MM) for 12 distinct categories. Accuracy values are represented as percentages with standard deviations, color-coded from purple (low accuracy) to yellow (high accuracy). The legend on the right maps colors to accuracy ranges (0.0–1.0).
### Components/Axes
- **X-axis (Columns)**: Models labeled as TTPD, LR, CCS, MM.
- **Y-axis (Rows)**: Categories:
- cities
- neg_cities
- sp_en_trans
- neg_sp_en_trans
- inventors
- neg_inventors
- animal_class
- neg_animal_class
- element_symb
- neg_element_symb
- facts
- neg_facts
- **Legend**: Color gradient from purple (0.0) to yellow (1.0), with intermediate orange shades.
- **Textual Values**: Each cell contains a percentage (e.g., "86 ± 1") and a standard deviation (e.g., "± 1").
### Detailed Analysis
#### Model Performance by Category
1. **TTPD**:
- **cities**: 86 ± 1 (orange-yellow)
- **neg_cities**: 96 ± 1 (yellow)
- **sp_en_trans**: 100 ± 0 (bright yellow)
- **neg_sp_en_trans**: 95 ± 2 (yellow)
- **inventors**: 92 ± 1 (yellow)
- **neg_inventors**: 93 ± 1 (yellow)
- **animal_class**: 99 ± 0 (bright yellow)
- **neg_animal_class**: 99 ± 0 (bright yellow)
- **element_symb**: 98 ± 0 (bright yellow)
- **neg_element_symb**: 99 ± 0 (bright yellow)
- **facts**: 90 ± 0 (orange)
- **neg_facts**: 79 ± 1 (orange-red)
2. **LR**:
- **cities**: 98 ± 2 (bright yellow)
- **neg_cities**: 99 ± 2 (bright yellow)
- **sp_en_trans**: 99 ± 1 (bright yellow)
- **neg_sp_en_trans**: 99 ± 1 (bright yellow)
- **inventors**: 90 ± 4 (orange)
- **neg_inventors**: 93 ± 2 (yellow)
- **animal_class**: 98 ± 1 (bright yellow)
- **neg_animal_class**: 99 ± 0 (bright yellow)
- **element_symb**: 98 ± 1 (bright yellow)
- **neg_element_symb**: 99 ± 1 (bright yellow)
- **facts**: 90 ± 1 (orange)
- **neg_facts**: 77 ± 3 (orange-red)
3. **CCS**:
- **cities**: 90 ± 10 (orange)
- **neg_cities**: 98 ± 7 (yellow)
- **sp_en_trans**: 88 ± 22 (orange-red)
- **neg_sp_en_trans**: 90 ± 21 (orange)
- **inventors**: 72 ± 20 (red)
- **neg_inventors**: 69 ± 18 (red)
- **animal_class**: 87 ± 19 (orange)
- **neg_animal_class**: 84 ± 22 (orange)
- **element_symb**: 86 ± 25 (orange)
- **neg_element_symb**: 92 ± 16 (yellow)
- **facts**: 82 ± 9 (orange)
- **neg_facts**: 75 ± 8 (orange-red)
4. **MM**:
- **cities**: 77 ± 2 (orange-red)
- **neg_cities**: 100 ± 0 (bright yellow)
- **sp_en_trans**: 99 ± 0 (bright yellow)
- **neg_sp_en_trans**: 99 ± 0 (bright yellow)
- **inventors**: 87 ± 2 (orange)
- **neg_inventors**: 94 ± 0 (yellow)
- **animal_class**: 99 ± 0 (bright yellow)
- **neg_animal_class**: 99 ± 0 (bright yellow)
- **element_symb**: 95 ± 1 (yellow)
- **neg_element_symb**: 98 ± 3 (bright yellow)
- **facts**: 89 ± 1 (orange)
- **neg_facts**: 72 ± 1 (orange-red)
### Key Observations
1. **High Accuracy**:
- **TTPD** and **LR** achieve near-perfect accuracy (99–100%) on `sp_en_trans`, `neg_sp_en_trans`, and `neg_animal_class`.
- **MM** excels in `neg_cities` (100 ± 0) and `neg_sp_en_trans` (99 ± 0).
- **CCS** struggles with `inventors` (72 ± 20) and `neg_inventors` (69 ± 18), showing high variance.
2. **Low Accuracy**:
- **CCS** performs poorly on `inventors` and `neg_inventors`, with the lowest values in the dataset.
- **TTPD** and **LR** have lower accuracy on `neg_facts` (79 ± 1 and 77 ± 3, respectively).
3. **Consistency**:
- Models with lower standard deviations (e.g., TTPD’s `sp_en_trans` at ±0) show more reliable performance.
- **CCS** exhibits high variance in multiple categories (e.g., `sp_en_trans`: ±22).
### Interpretation
- **Model Strengths**:
- **TTPD** and **LR** perform robustly on text-based categories (`sp_en_trans`, `neg_sp_en_trans`) and structured data (`animal_class`, `element_symb`).
- **MM** excels in handling negative examples (`neg_cities`, `neg_sp_en_trans`), suggesting specialized preprocessing or architecture advantages.
- **CCS** underperforms in specialized categories (`inventors`, `neg_inventors`), possibly due to limited training data or feature representation.
- **Category Challenges**:
- `neg_inventors` and `inventors` are the weakest categories across all models, indicating potential data scarcity or complexity.
- `neg_facts` consistently shows lower accuracy, suggesting negative examples are harder to classify.
- **Color-Value Alignment**:
- Yellow shades (high accuracy) dominate for `neg_cities`, `sp_en_trans`, and `neg_animal_class`.
- Red/orange shades (low accuracy) cluster around `inventors`, `neg_inventors`, and `neg_facts`.
This heatmap highlights trade-offs between model architectures and category-specific performance, with **TTPD** and **LR** offering balanced accuracy, while **MM** and **CCS** show niche strengths and weaknesses.