## Pie Charts: By Category and By Difficulty
### Overview
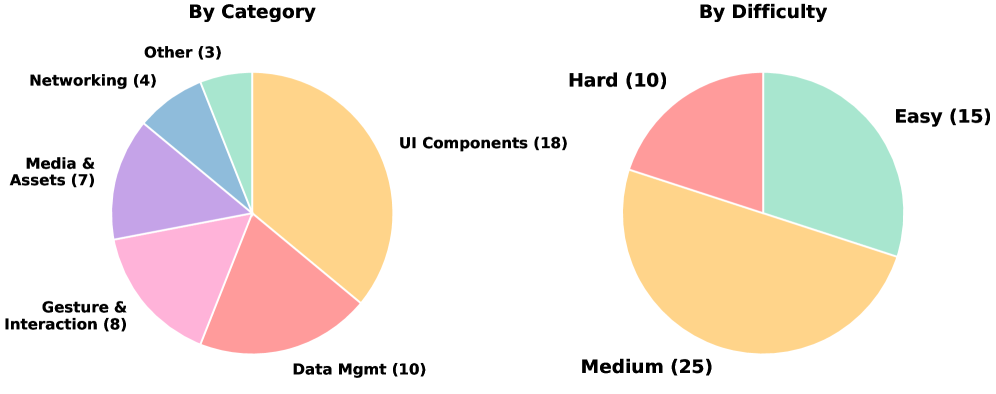
The image contains two adjacent pie charts. The left chart categorizes data by component type, while the right chart categorizes data by difficulty level. Both charts use distinct color coding and include numerical annotations for each segment.
### Components/Axes
**Left Chart ("By Category"):**
- **Title**: "By Category" (top-center)
- **Legend**: Right-aligned, with color-coded labels:
- Orange: UI Components (18)
- Red: Data Mgmt (10)
- Pink: Gesture & Interaction (8)
- Purple: Media & Assets (7)
- Blue: Networking (4)
- Green: Other (3)
- **Segments**: Six labeled sections with numerical values.
**Right Chart ("By Difficulty"):**
- **Title**: "By Difficulty" (top-center)
- **Legend**: Right-aligned, with color-coded labels:
- Green: Easy (15)
- Orange: Medium (25)
- Red: Hard (10)
- **Segments**: Three labeled sections with numerical values.
### Detailed Analysis
**Left Chart ("By Category"):**
- **UI Components (18)**: Largest segment (orange), occupying ~36% of the chart.
- **Data Mgmt (10)**: Second-largest (red), ~20%.
- **Gesture & Interaction (8)**: ~16% (pink).
- **Media & Assets (7)**: ~14% (purple).
- **Networking (4)**: ~8% (blue).
- **Other (3)**: Smallest segment (~6%) (green).
**Right Chart ("By Difficulty"):**
- **Medium (25)**: Largest segment (orange), ~50% of the chart.
- **Easy (15)**: ~30% (green).
- **Hard (10)**: ~20% (red).
### Key Observations
1. **Dominance of UI Components**: UI Components account for the largest share in the "By Category" chart, suggesting a focus on user interface design.
2. **Medium Difficulty Prevalence**: Medium difficulty tasks dominate the "By Difficulty" chart, indicating most work falls into this category.
3. **Small Segments**: Networking and "Other" categories are minimal in the "By Category" chart, while "Hard" difficulty is the smallest in the "By Difficulty" chart.
### Interpretation
The data implies a project structure where **UI Components** are prioritized, and **Medium-difficulty tasks** are most common. This could reflect:
- A team with moderate expertise, as Medium tasks are neither too easy nor too hard.
- A design-heavy project, given the emphasis on UI Components.
- Potential underinvestment in Networking and "Other" categories, which may require further analysis for completeness.
The charts highlight a balance between component focus and task complexity, with Medium difficulty serving as the central workload.