## Light Curve Analysis: KMT-2019-BLG-1367
### Overview
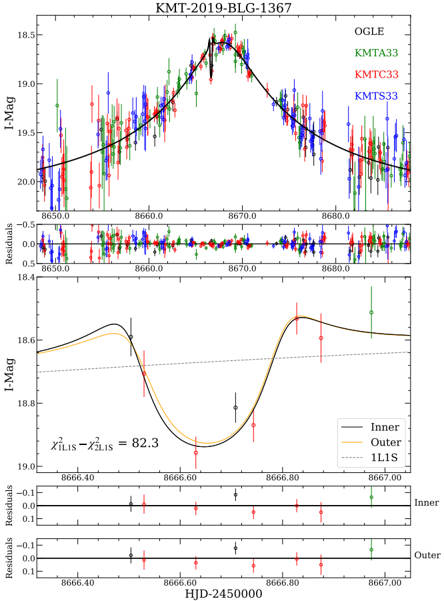
The image presents a light curve analysis of the astronomical object KMT-2019-BLG-1367. It includes plots of I-band magnitude (I-Mag) versus time (HJD-2450000), along with residual plots. The data is from multiple observatories (OGLE, KMTA33, KMTC33, KMTS33). The analysis focuses on modeling the light curve with different models (Inner, Outer, 1L1S) to understand the underlying astrophysical processes.
### Components/Axes
* **Top Panel:**
* **Title:** KMT-2019-BLG-1367
* **Y-axis:** I-Mag (I-band magnitude), ranging from approximately 18.5 to 20.5.
* **X-axis:** HJD-2450000 (Heliocentric Julian Date minus 2450000), ranging from 8650 to 8680.
* **Data Series:**
* OGLE: Green data points with error bars.
* KMTA33: Red data points with error bars.
* KMTC33: Pink data points with error bars.
* KMTS33: Blue data points with error bars.
* Model Fit: Black line representing the overall model fit to the data.
* **Top Residual Panel:**
* **Y-axis:** Residuals, ranging from -0.5 to 0.5.
* **X-axis:** HJD-2450000, ranging from 8650 to 8680.
* Residuals for each data series are plotted with corresponding colors.
* **Bottom Panel:**
* **Y-axis:** I-Mag, ranging from 18.4 to 19.0.
* **X-axis:** HJD-2450000, ranging from 8666.40 to 8667.00.
* **Data Series:**
* Inner: Black line.
* Outer: Orange line.
* 1L1S: Dashed gray line.
* Data points with error bars, color not specified.
* **Text:** "χ²₁L₁S - χ²₂L₁S = 82.3" (Chi-squared difference between models).
* **Bottom Residual Panels:**
* **Y-axis:** Residuals, ranging from -0.1 to 0.1.
* **X-axis:** HJD-2450000, ranging from 8666.40 to 8667.00.
* Two residual plots are shown, labeled "Inner" and "Outer".
### Detailed Analysis
* **Top Panel:**
* The light curve shows a clear dip, indicating a possible microlensing event or eclipse.
* The peak of the event occurs around HJD-2450000 = 8667.
* The data points from different observatories generally agree, although there is some scatter.
* The black line represents a model fit to the data, capturing the overall shape of the light curve.
* The residuals appear to be randomly distributed around zero, suggesting a good fit.
* OGLE (green) data points are present throughout the entire range.
* KMTA33 (red) data points are present throughout the entire range.
* KMTC33 (pink) data points are present mostly around the peak.
* KMTS33 (blue) data points are present throughout the entire range.
* **Bottom Panel:**
* This panel focuses on the region around the dip in the light curve.
* The "Inner" (black) and "Outer" (orange) models are compared to a "1L1S" (dashed gray) model.
* The "Inner" and "Outer" models appear to fit the data better than the "1L1S" model, especially around the peak.
* The residuals for the "Inner" and "Outer" models are shown in the bottom panels.
* The chi-squared difference between the 1L1S and 2L1S models is 82.3, suggesting a statistically significant improvement in the fit.
### Key Observations
* The light curve exhibits a significant dip, indicating a possible microlensing event or eclipse.
* The "Inner" and "Outer" models provide a better fit to the data than the "1L1S" model.
* The chi-squared difference suggests that the "Inner" and "Outer" models are statistically more significant.
### Interpretation
The data suggests that the observed dip in the light curve of KMT-2019-BLG-1367 is likely due to a microlensing event or eclipse. The comparison of different models indicates that the "Inner" and "Outer" models provide a better explanation of the data than the "1L1S" model. The chi-squared difference supports this conclusion. Further analysis may be needed to determine the exact nature of the event and the properties of the lensing object. The different observatories provide complementary data, enhancing the reliability of the analysis.