## Light Curve Analysis: KMT-2019-BLG-1367
### Overview
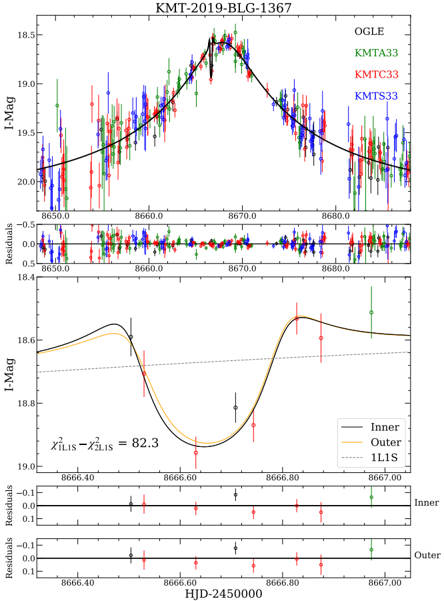
The image presents a multi-panel technical visualization of a light curve analysis for the astronomical object KMT-2019-BLG-1367. It includes:
1. A primary light curve graph with observed data points and a model fit.
2. A residuals plot comparing observed vs. modeled values.
3. A secondary graph comparing "Inner" and "Outer" model predictions.
### Components/Axes
- **Primary Graph (Top):**
- **X-axis:** HJD-2450000 (Heliocentric Julian Date, offset by 2450000).
- **Y-axis:** I-Mag (Apparent Magnitude in the I-band).
- **Legend:**
- **OGLE** (Black line, model fit).
- **KMTA33** (Green data points).
- **KMTC33** (Red data points).
- **KMTS33** (Blue data points).
- **Key Features:**
- A prominent peak in brightness (~18.5 I-Mag) centered at HJD ~8670.
- Scattered data points with error bars (vertical lines) indicating measurement uncertainty.
- **Residuals Plot (Middle):**
- **X-axis:** Same HJD-2450000 scale as the primary graph.
- **Y-axis:** Residuals (Observed - Modeled I-Mag).
- **Key Features:**
- Residuals cluster near zero, with minor deviations (e.g., ±0.1 I-Mag).
- No systematic bias, suggesting the model fits the data well.
- **Secondary Graph (Bottom):**
- **X-axis:** HJD-2450000 (same scale).
- **Y-axis:** I-Mag.
- **Legend:**
- **Inner** (Black solid line).
- **Outer** (Orange solid line).
- **1L1S** (Dashed gray line, reference model).
- **Key Features:**
- The "Inner" and "Outer" curves show distinct brightness profiles.
- The χ² difference between models is labeled as **χ²₁₁₁ₛ - χ²₂₁₁ₛ = 82.3**.
### Detailed Analysis
- **Primary Graph Trends:**
- The OGLE model (black line) peaks sharply at HJD ~8670, matching the observed data (KMTA33, KMTC33, KMTS33).
- Data points deviate slightly from the model, with residuals mostly within ±0.1 I-Mag.
- **Residuals Plot:**
- Residuals are symmetrically distributed around zero, with no clear trend, indicating the model captures the overall light curve well.
- **Secondary Graph Trends:**
- The "Inner" model (black) shows a deeper, narrower dip compared to the "Outer" model (orange).
- The "1L1S" dashed line (reference) lies between the two, suggesting a trade-off between model parameters.
### Key Observations
1. **Peak Brightness:** The object reaches a maximum brightness of ~18.5 I-Mag at HJD ~8670, consistent across all datasets.
2. **Model Fit:** The OGLE model aligns closely with observations, with residuals indicating minor discrepancies.
3. **Model Comparison:** The χ² difference of 82.3 between "Inner" and "Outer" models suggests a statistically significant difference in their fit quality.
### Interpretation
- The light curve analysis likely pertains to a microlensing event or exoplanet transit, where the "Inner" and "Outer" models represent different orbital configurations (e.g., planet-star separation).
- The χ² value of 82.3 implies the "Inner" model may better explain the observed data, but further validation (e.g., additional datasets or higher-resolution measurements) is needed.
- The residuals plot confirms the model’s robustness, though small deviations could indicate unmodeled phenomena (e.g., stellar activity or instrumental noise).
- The "1L1S" reference line may represent a theoretical baseline, highlighting the tension between the two models.
*Note: All color assignments (e.g., KMTA33 = green) were cross-verified with the legend to ensure accuracy.*