\n
## Radar Chart: Model Performance Comparison
### Overview
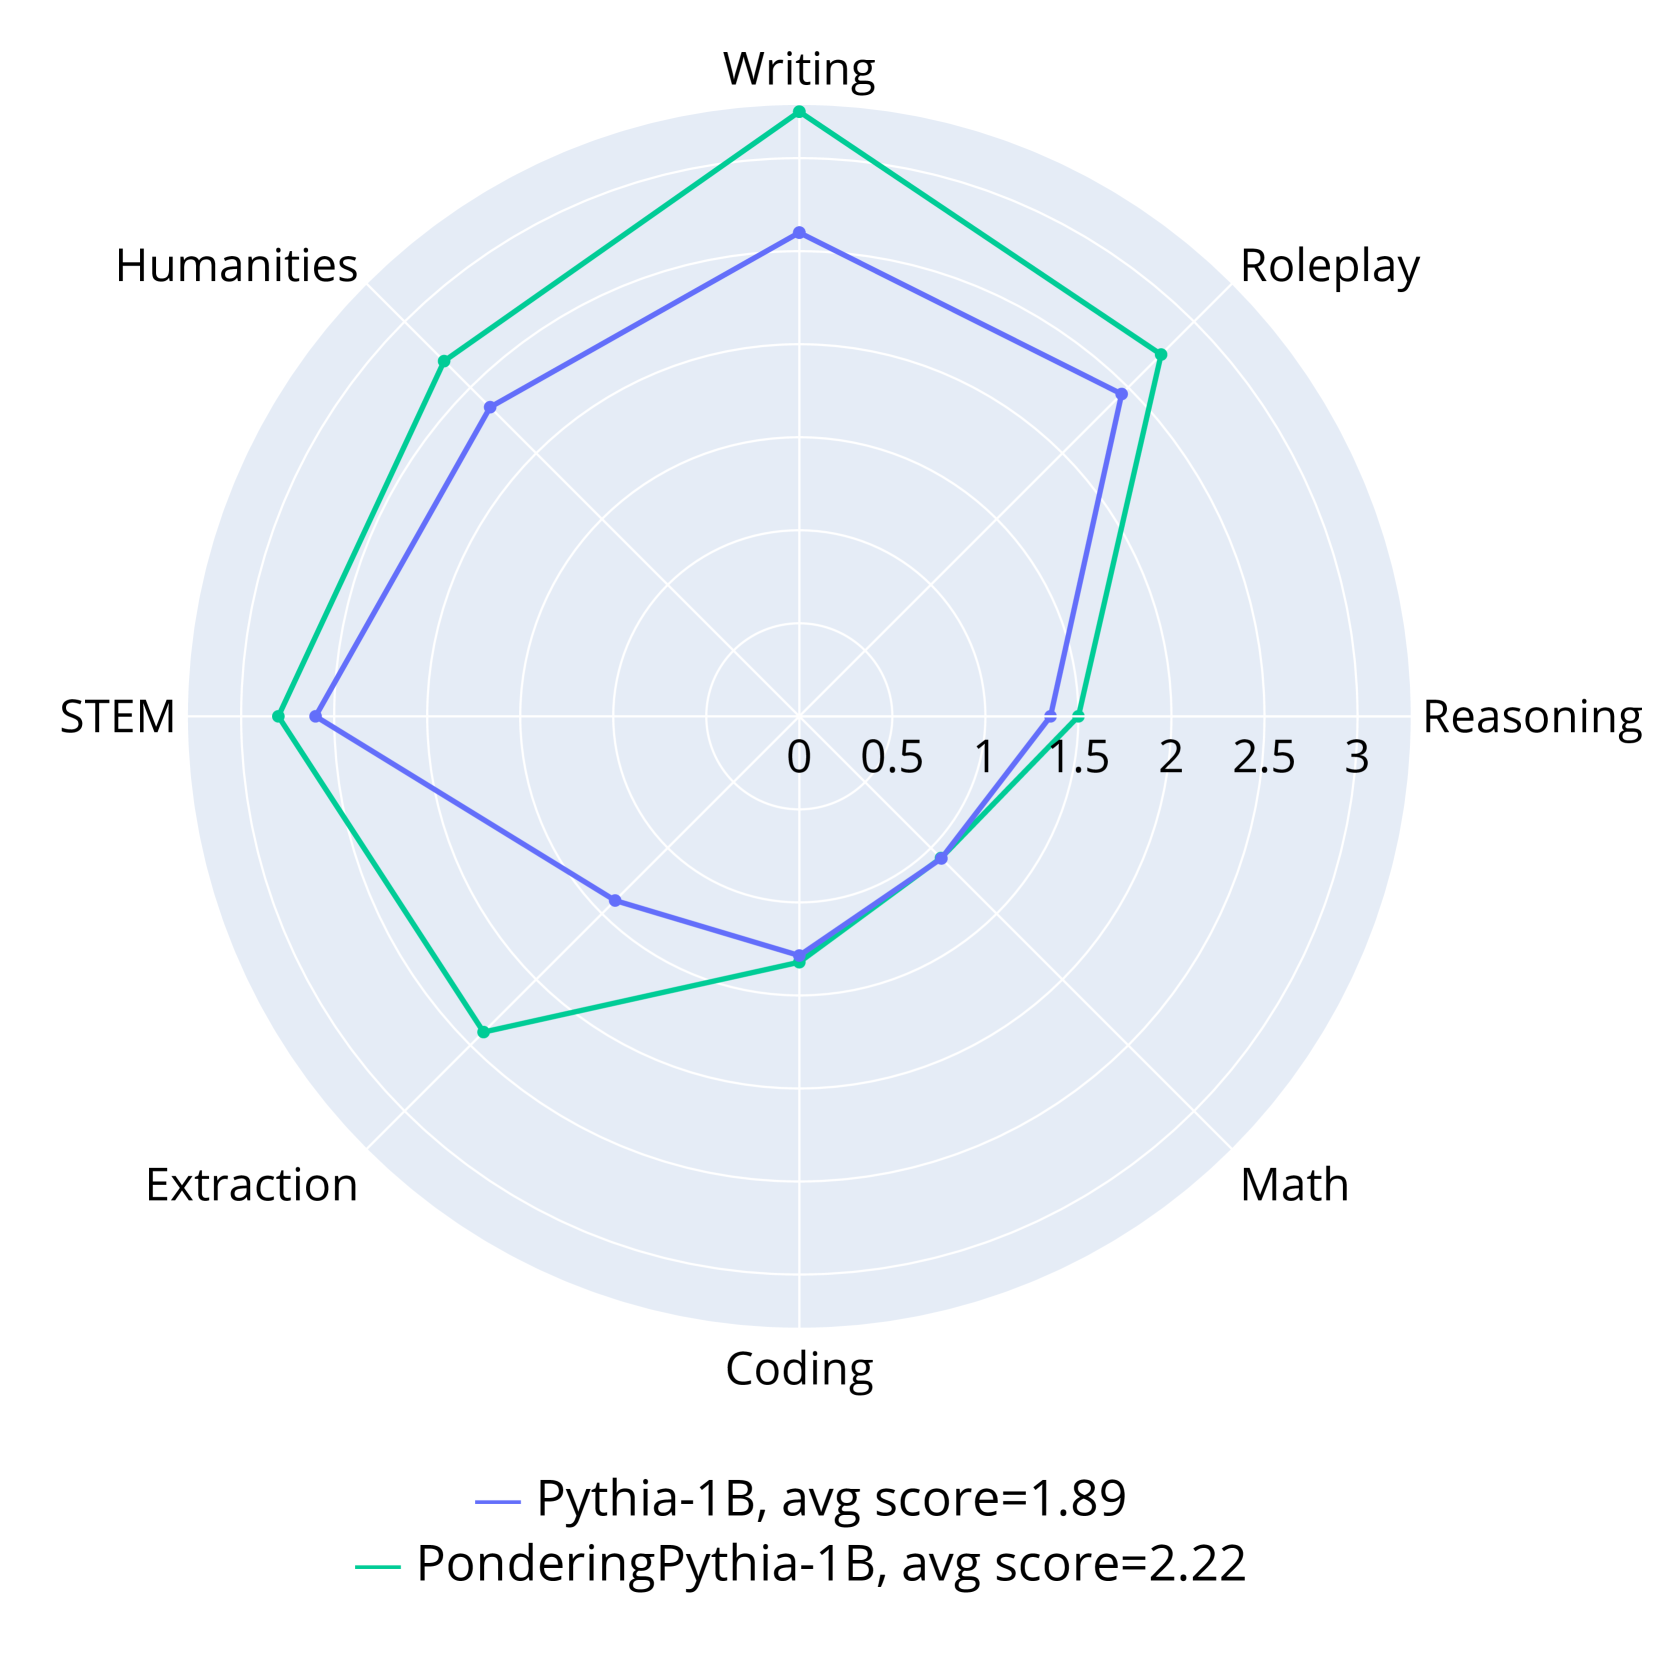
This image presents a radar chart comparing the performance of two models, "Pythia-1B" and "PonderingPythia-1B", across seven different categories. The chart uses a radial layout with each axis representing a category, and the distance from the center indicating the score.
### Components/Axes
* **Axes/Categories:** The radar chart has seven axes, each labeled with a different skill or domain:
* Writing
* Roleplay
* Reasoning
* Math
* Coding
* Extraction
* STEM
* Humanities
* **Radial Scale:** The radial scale ranges from 0 to 3, with markers at 0, 0.5, 1, 1.5, 2, 2.5, and 3.
* **Legend:** Located at the bottom-right of the chart, the legend identifies the two data series:
* **Pythia-1B:** Represented by a blue line, with an average score of 1.89.
* **PonderingPythia-1B:** Represented by a green line, with an average score of 2.22.
### Detailed Analysis
The chart displays two polygonal lines representing the performance of each model across the seven categories.
**Pythia-1B (Blue Line):**
The line generally fluctuates between approximately 1.2 and 2.5.
* **Writing:** Approximately 2.3
* **Roleplay:** Approximately 2.1
* **Reasoning:** Approximately 1.7
* **Math:** Approximately 1.5
* **Coding:** Approximately 1.2
* **Extraction:** Approximately 1.3
* **STEM:** Approximately 1.6
* **Humanities:** Approximately 1.8
**PonderingPythia-1B (Green Line):**
The line generally fluctuates between approximately 1.7 and 2.8.
* **Writing:** Approximately 2.8
* **Roleplay:** Approximately 2.6
* **Reasoning:** Approximately 2.3
* **Math:** Approximately 2.0
* **Coding:** Approximately 1.7
* **Extraction:** Approximately 2.1
* **STEM:** Approximately 2.2
* **Humanities:** Approximately 2.4
### Key Observations
* **Overall Performance:** PonderingPythia-1B consistently outperforms Pythia-1B across all categories, as indicated by the higher average score (2.22 vs. 1.89) and the generally outward positioning of the green line.
* **Strengths:** PonderingPythia-1B demonstrates particularly strong performance in Writing (approximately 2.8) and Roleplay (approximately 2.6).
* **Weaknesses:** Pythia-1B shows relatively lower performance in Coding (approximately 1.2) and Math (approximately 1.5).
* **Shape:** Both lines have a somewhat irregular shape, indicating varying levels of performance across the different categories.
### Interpretation
The radar chart effectively visualizes the comparative strengths and weaknesses of the two models. PonderingPythia-1B appears to be a more versatile model, achieving higher scores across a broader range of tasks. The chart suggests that PonderingPythia-1B has been trained or fine-tuned to excel in areas like creative writing and interactive role-playing, while Pythia-1B may be relatively weaker in these domains. The differences in performance could be attributed to variations in the training data, model architecture, or training methodology. The chart provides a clear and concise overview of the models' capabilities, allowing for informed decision-making regarding their application in specific tasks. The average scores provide a single metric for overall comparison, while the detailed category-specific scores offer a more nuanced understanding of their respective strengths and weaknesses.