## Line Graph: Model Accuracy vs. Sample Size
### Overview
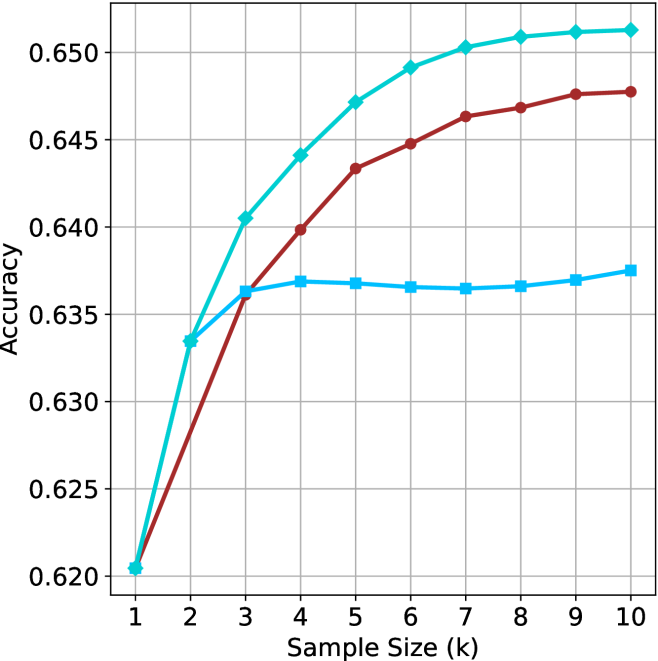
The graph illustrates the relationship between sample size (k) and accuracy for three models (A, B, C). Accuracy is measured on the y-axis (0.620–0.650), while sample size ranges from 1 to 10 on the x-axis. Three distinct trends are observed: Model A shows steady improvement, Model B exhibits rapid growth after small sample sizes, and Model C remains flat.
### Components/Axes
- **X-axis**: Sample Size (k) with integer markers (1–10).
- **Y-axis**: Accuracy (0.620–0.650) with increments of 0.005.
- **Legend**: Located in the top-right corner, associating:
- Teal line → Model A
- Red line → Model B
- Blue line → Model C
### Detailed Analysis
1. **Model A (Teal)**:
- Starts at ~0.630 (k=1).
- Gradually increases to ~0.650 by k=10.
- Slope: ~0.002 per unit increase in k.
- Notable: Consistent upward trend with minimal fluctuation.
2. **Model B (Red)**:
- Begins at ~0.620 (k=1).
- Sharp rise to ~0.635 at k=2, then accelerates to ~0.648 at k=10.
- Slope: ~0.013 per unit increase in k after k=2.
- Notable: Outperforms Model A after k=3.
3. **Model C (Blue)**:
- Flat line at ~0.635–0.638 across all k.
- No improvement with larger sample sizes.
- Notable: Stable but lowest final accuracy.
### Key Observations
- Model B demonstrates the most significant improvement, surpassing Model A after k=3.
- Model C’s performance is independent of sample size, suggesting limited scalability.
- Model A’s steady growth indicates moderate sensitivity to sample size.
### Interpretation
The data suggests that **Model B** benefits disproportionately from larger datasets, potentially due to higher complexity or non-linear learning dynamics. **Model C**’s flat trend implies it may be optimized for small samples or lacks capacity to leverage additional data. **Model A** balances scalability and performance, making it suitable for moderate sample sizes. The divergence between Models B and C highlights the importance of sample size in model selection, particularly for complex architectures. Uncertainties in accuracy values (~±0.002) reflect visual estimation limitations.