## Chart: Circular Distribution Function
### Overview
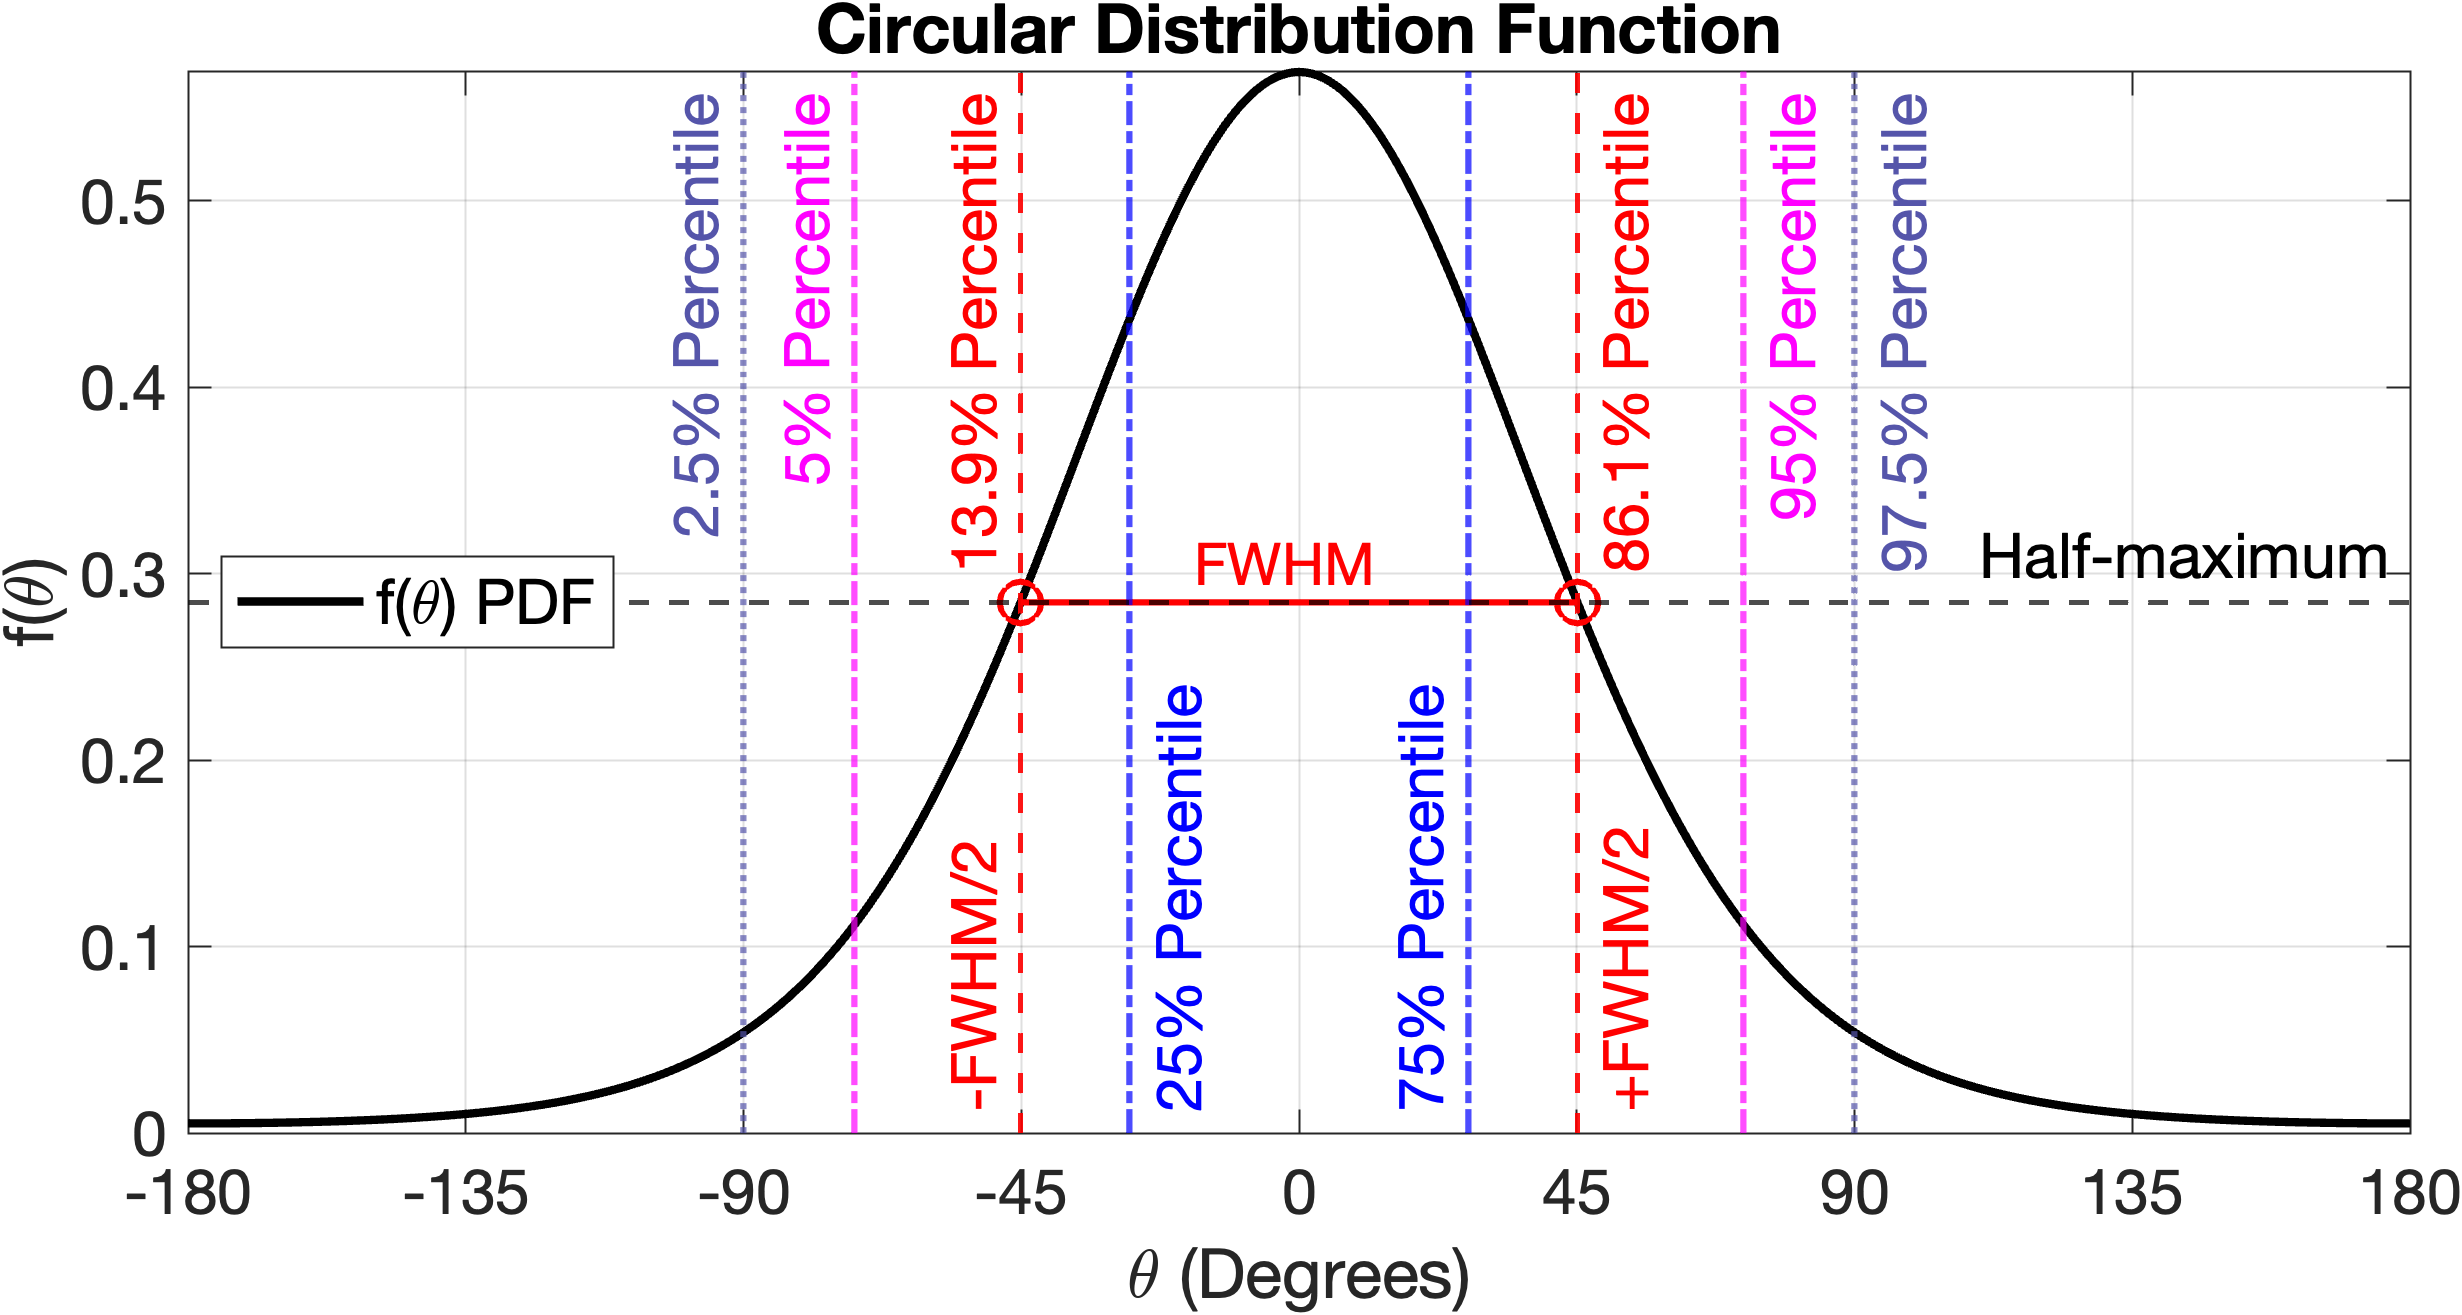
The image is a plot of a circular distribution function, showing the probability density function (PDF) f(θ) as a function of θ (Degrees). The plot highlights key percentiles and the Full Width at Half Maximum (FWHM).
### Components/Axes
* **Title:** Circular Distribution Function
* **X-axis:** θ (Degrees), ranging from -180 to 180, with tick marks at -180, -135, -90, -45, 0, 45, 90, 135, and 180.
* **Y-axis:** f(θ), ranging from 0 to 0.5, with tick marks at 0, 0.1, 0.2, 0.3, 0.4, and 0.5.
* **Curve:** A bell-shaped curve representing the probability density function f(θ) PDF, centered at θ = 0.
* **Horizontal Dashed Line:** Indicates the "Half-maximum" value, intersecting the y-axis at approximately 0.28-0.3.
* **Vertical Dashed Lines:** Represent various percentiles of the distribution.
* 2.5% Percentile (light blue) at approximately -90 degrees.
* 5% Percentile (magenta) at approximately -70 degrees.
* 13.9% Percentile (red) at approximately -45 degrees.
* 25% Percentile (blue) at approximately -30 degrees.
* 75% Percentile (blue) at approximately +30 degrees.
* 86.1% Percentile (red) at approximately +45 degrees.
* 95% Percentile (magenta) at approximately +70 degrees.
* 97.5% Percentile (light blue) at approximately +90 degrees.
* **FWHM:** A red horizontal line segment indicating the Full Width at Half Maximum, centered around 0 degrees. The endpoints of this line intersect the curve at the half-maximum value.
* -FWHM/2 (red) at approximately -45 degrees.
* +FWHM/2 (red) at approximately +45 degrees.
### Detailed Analysis
* **f(θ) PDF:** The black curve represents the probability density function. It is symmetric around θ = 0, reaching a maximum value of approximately 0.52.
* **Half-maximum:** The horizontal dashed line is at approximately f(θ) = 0.29.
* **Percentiles:** The vertical dashed lines indicate the θ values corresponding to the given percentiles.
* 2.5% Percentile: θ ≈ -90 degrees
* 5% Percentile: θ ≈ -70 degrees
* 13.9% Percentile: θ ≈ -45 degrees
* 25% Percentile: θ ≈ -30 degrees
* 75% Percentile: θ ≈ +30 degrees
* 86.1% Percentile: θ ≈ +45 degrees
* 95% Percentile: θ ≈ +70 degrees
* 97.5% Percentile: θ ≈ +90 degrees
* **FWHM:** The Full Width at Half Maximum spans from approximately -45 degrees to +45 degrees.
### Key Observations
* The distribution is symmetric around θ = 0.
* The FWHM is centered at θ = 0.
* The percentiles are symmetrically distributed around θ = 0.
### Interpretation
The plot illustrates a circular distribution function, likely a von Mises distribution or a similar distribution used for circular data. The symmetry around θ = 0 suggests that the mean direction is 0 degrees. The FWHM provides a measure of the spread or concentration of the distribution. The percentiles give an indication of the distribution's shape and how the data is distributed around the mean direction. The plot is useful for visualizing and understanding the properties of circular data.