\n
## Chart: Circular Distribution Function
### Overview
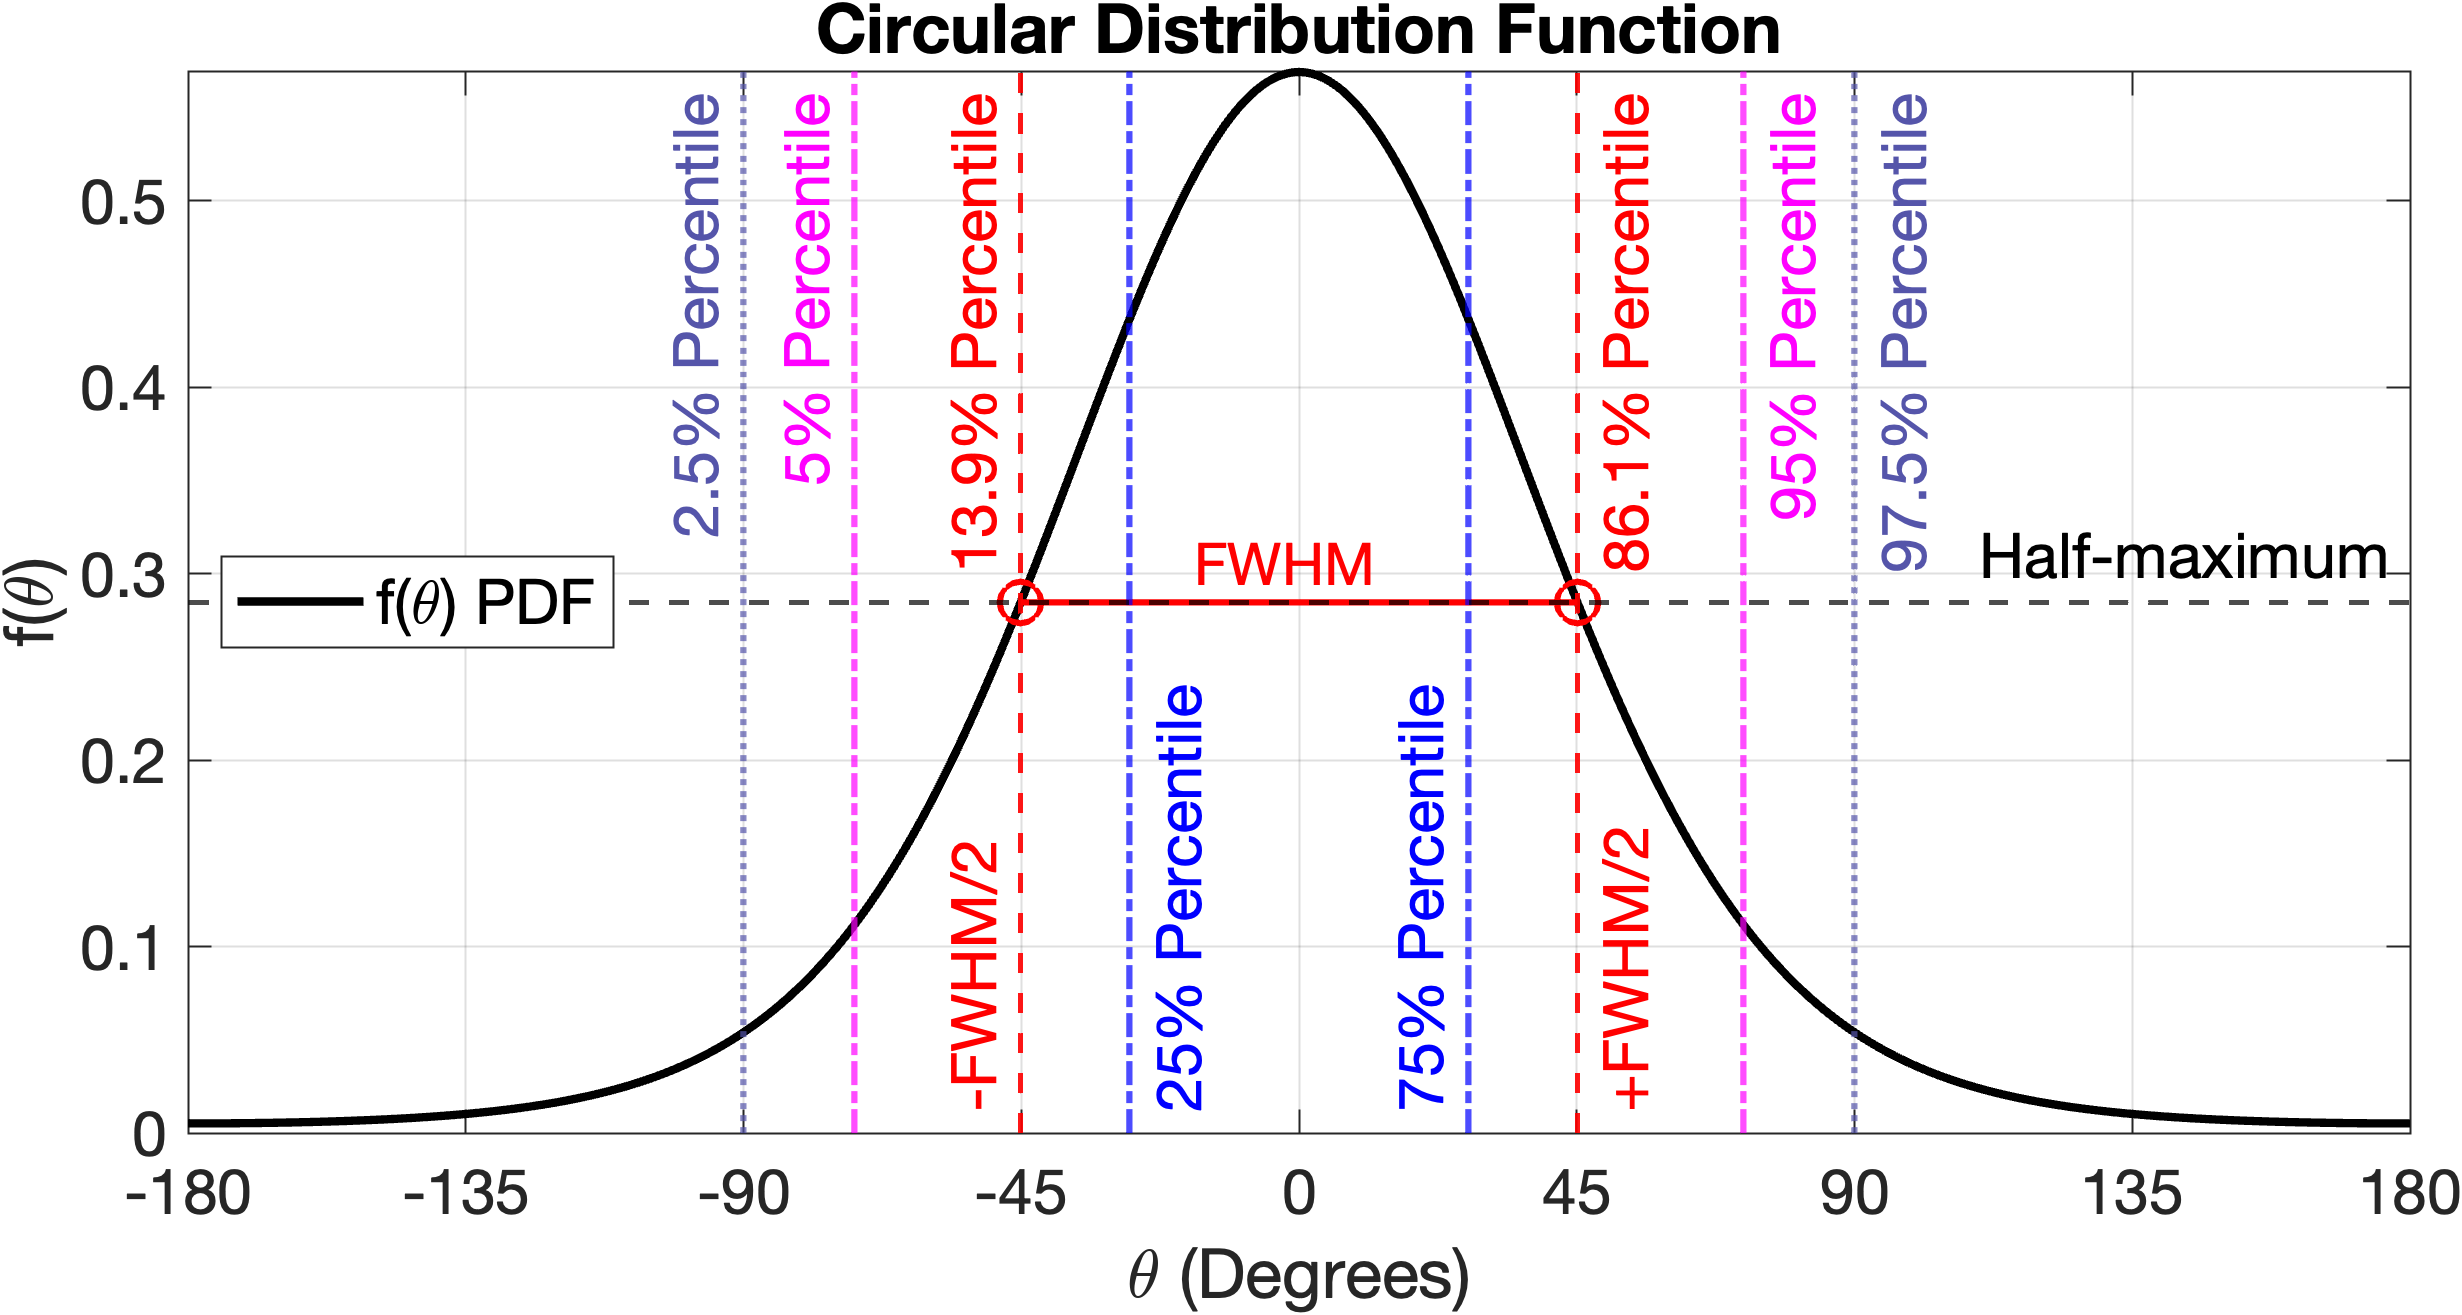
The image presents a chart illustrating a circular distribution function, specifically a Probability Density Function (PDF). The chart displays the function's behavior across a range of angles (θ) in degrees, from -180 to 180. Several percentile markers and the Full Width at Half Maximum (FWHM) are indicated on the plot.
### Components/Axes
* **Title:** "Circular Distribution Function"
* **X-axis:** θ (Degrees), ranging from -180 to 180. The axis is labeled "θ (Degrees)".
* **Y-axis:** f(θ) PDF, ranging from 0 to 0.6. The axis is labeled "f(θ) PDF".
* **Curve:** A black solid line representing the f(θ) PDF.
* **Vertical Lines:** Multiple vertical dashed lines indicating percentile values and FWHM boundaries.
* **Legend:** A single entry: "f(θ) PDF" associated with the black curve.
* **Percentile Markers:** Labels indicating percentile values (2.5%, 5%, 13.9%, 25%, 75%, 86.1%, 95%, 97.5%).
* **FWHM Marker:** Label indicating "FWHM".
* **Half-maximum Marker:** Label indicating "Half-maximum".
* **FWHM/2 Markers:** Labels indicating "-FWHM/2" and "+FWHM/2".
### Detailed Analysis
The black curve representing f(θ) PDF is symmetrical around θ = 0. It rises from 0 at θ = -180, reaches a maximum value of approximately 0.6 at θ = 0, and then decreases back to 0 at θ = 180.
* **2.5% Percentile:** Located at approximately θ = -95 degrees.
* **5% Percentile:** Located at approximately θ = -85 degrees.
* **13.9% Percentile:** Located at approximately θ = -65 degrees.
* **25% Percentile:** Located at approximately θ = -45 degrees.
* **75% Percentile:** Located at approximately θ = 45 degrees.
* **86.1% Percentile:** Located at approximately θ = 65 degrees.
* **95% Percentile:** Located at approximately θ = 85 degrees.
* **97.5% Percentile:** Located at approximately θ = 95 degrees.
* **FWHM:** The FWHM spans from approximately θ = -45 degrees to θ = 45 degrees.
* **-FWHM/2:** Located at approximately θ = -45 degrees.
* **+FWHM/2:** Located at approximately θ = 45 degrees.
* **Half-maximum:** The half-maximum value on the y-axis is approximately 0.3.
The curve appears to be a Gaussian-like distribution, but adapted for circular data.
### Key Observations
* The distribution is symmetrical around θ = 0.
* The FWHM provides a measure of the spread of the distribution.
* The percentile markers indicate the range of angles corresponding to specific probabilities.
* The maximum value of the PDF is approximately 0.6.
### Interpretation
This chart demonstrates a circular probability distribution. The function f(θ) PDF describes the likelihood of observing a particular angle θ. The symmetry suggests that angles are equally likely to occur on either side of the central tendency (θ = 0). The FWHM and percentile markers provide quantitative measures of the distribution's spread and shape. This type of distribution is commonly used in fields like directional statistics, where data is inherently circular (e.g., wind direction, animal orientation). The chart effectively visualizes how probabilities are distributed around a circle, offering insights into the concentration or dispersion of directional data. The use of percentiles allows for easy interpretation of the probability associated with specific angular ranges.