## Diagram: Grid-Based Maze with Pathfinding Route
### Overview
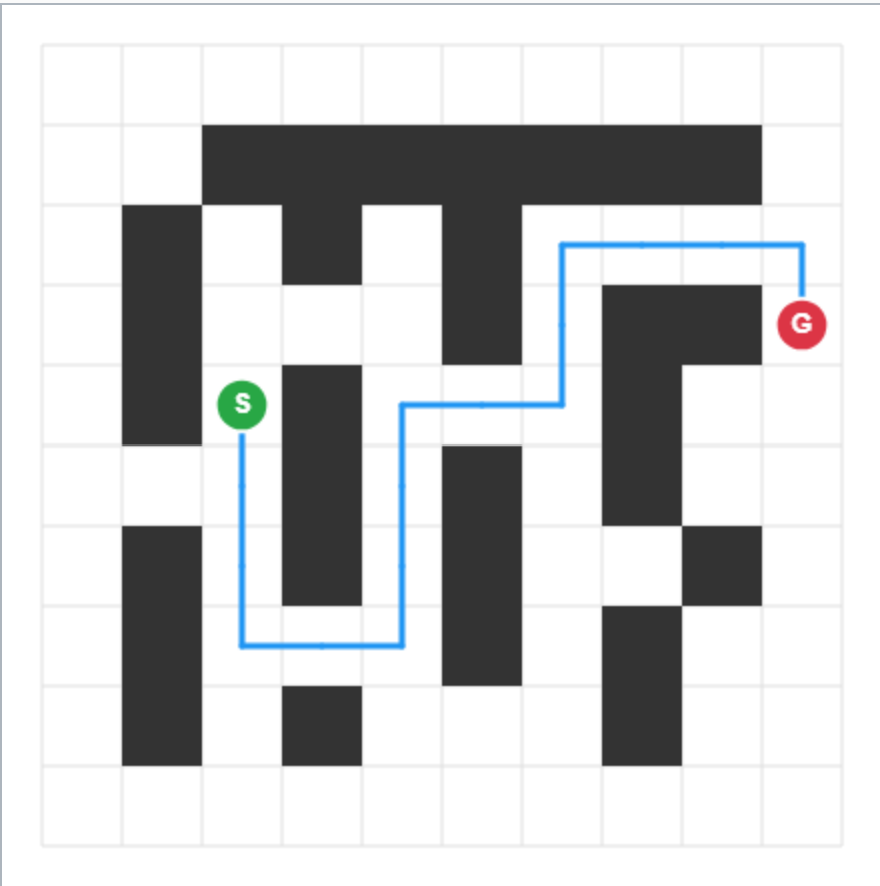
The image depicts a 10x10 grid-based maze with black squares representing obstacles and white squares representing traversable paths. A blue dashed line traces a path from a green-labeled start point ("S") to a red-labeled goal point ("G"). The maze contains no textual annotations beyond the "S" and "G" labels.
### Components/Axes
- **Grid Structure**:
- 10x10 grid with alternating black (obstacles) and white (paths) squares.
- No axis titles, scales, or numerical markers.
- **Path**:
- Blue dashed line connecting "S" (bottom-left quadrant) to "G" (top-right quadrant).
- Path navigates around obstacles, forming a zigzag pattern.
- **Labels**:
- "S" (green circle) positioned at grid coordinates (3, 5) (row 3, column 5).
- "G" (red circle) positioned at grid coordinates (8, 9) (row 8, column 9).
- **Legend**:
- No explicit legend present. Colors are inferred:
- Black = Obstacles
- White = Traversable paths
- Blue = Pathfinding route
- Green = Start ("S")
- Red = Goal ("G")
### Detailed Analysis
- **Pathfinding Route**:
- The blue path begins at "S" (3,5), moves upward to (3,7), then right to (5,7), down to (5,5), right to (7,5), up to (7,7), and finally right to "G" (8,9).
- Total path length: 12 grid units (approximate, based on dashed line segments).
- **Obstacle Distribution**:
- Black squares form vertical/horizontal barriers, creating a labyrinthine structure.
- Notable obstacle clusters:
- Left side: Vertical black column at column 1 (rows 1–10).
- Center: Horizontal black bar at row 2 (columns 3–9).
- Right side: Vertical black column at column 9 (rows 1–10).
### Key Observations
1. The path avoids all black obstacles, adhering strictly to white squares.
2. The route prioritizes horizontal movement over vertical in the upper half of the grid.
3. No dead-ends or loops in the path; it is a direct, non-repeating trajectory.
4. The maze lacks symmetry, with uneven obstacle placement favoring the right side.
### Interpretation
This diagram illustrates a classic pathfinding problem, likely used to demonstrate algorithms like A* or Dijkstra’s. The absence of a legend implies the diagram assumes prior knowledge of standard maze conventions (e.g., black = blocked, white = open). The path’s efficiency suggests an optimal solution, though the lack of alternative routes prevents comparison. The "S" and "G" labels anchor the problem’s objective: navigating from start to goal while avoiding obstacles. The grid’s irregular obstacle distribution highlights the importance of adaptive pathfinding strategies in non-uniform environments.