# Technical Document Extraction: RoPE vs Context-Size Graph
## Axes and Labels
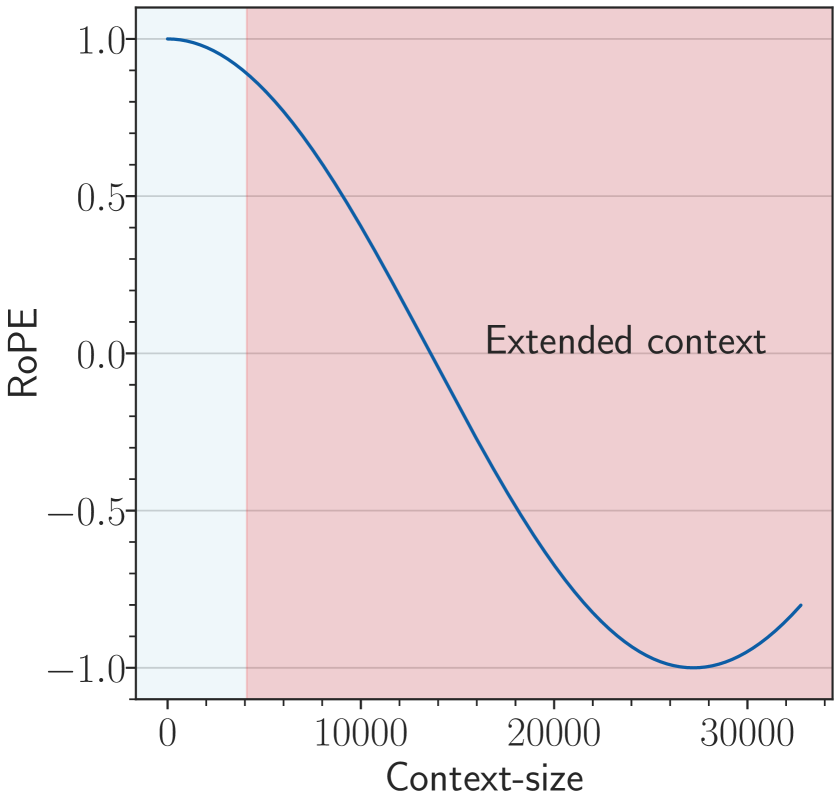
- **X-axis**:
- Label: `Context-size`
- Range: `0` to `30,000`
- Tick marks: `0`, `10,000`, `20,000`, `30,000`
- **Y-axis**:
- Label: `RoPE`
- Range: `-1.0` to `1.0`
- Tick marks: `-1.0`, `-0.5`, `0.0`, `0.5`, `1.0`
## Line Data
- **Line Color**: Blue
- **Trend**:
- Starts at `(0, 1.0)`
- Monotonically decreases to `(30,000, -1.0)`
- Crosses `RoPE = 0` at approximately `Context-size = 25,000`
- **Key Points**:
- `(0, 1.0)`: Initial value
- `(30,000, -1.0)`: Final value
## Shaded Regions
1. **Left Region** (Light Blue):
- Label: `Original context`
- Bounds: `Context-size = 0` to `5,000`
2. **Right Region** (Pink):
- Label: `Extended context`
- Bounds: `Context-size = 5,000` to `30,000`
## Legend
- **Placement**: Upper-right corner
- **Entries**:
- `Original context` ↔ Light Blue
- `Extended context` ↔ Pink
## Spatial Grounding
- Vertical blue line at `Context-size = 5,000` divides the graph into two regions.
- Legend colors match shaded regions exactly.
## Trend Verification
- **Line Behavior**:
- Steep decline from `Context-size = 0` to `10,000`
- Gradual decline from `10,000` to `25,000` (crosses zero)
- Sharp decline from `25,000` to `30,000`
## Component Isolation
1. **Header**: None
2. **Main Chart**:
- Line plot with dual-shaded regions
- Axes labeled with numerical ranges
3. **Footer**: None
## Data Table (Reconstructed)
| Context-size | RoPE | Region |
|--------------|-------|-------------------|
| 0 | 1.0 | Original context |
| 5,000 | 0.0 | Boundary |
| 10,000 | 0.25 | Extended context |
| 20,000 | -0.25 | Extended context |
| 25,000 | 0.0 | Extended context |
| 30,000 | -1.0 | Extended context |
## Notes
- No additional text or data tables present.
- All textual information extracted as per image content.