# Technical Document Extraction: RoPE vs. Context-size Analysis
## 1. Image Overview
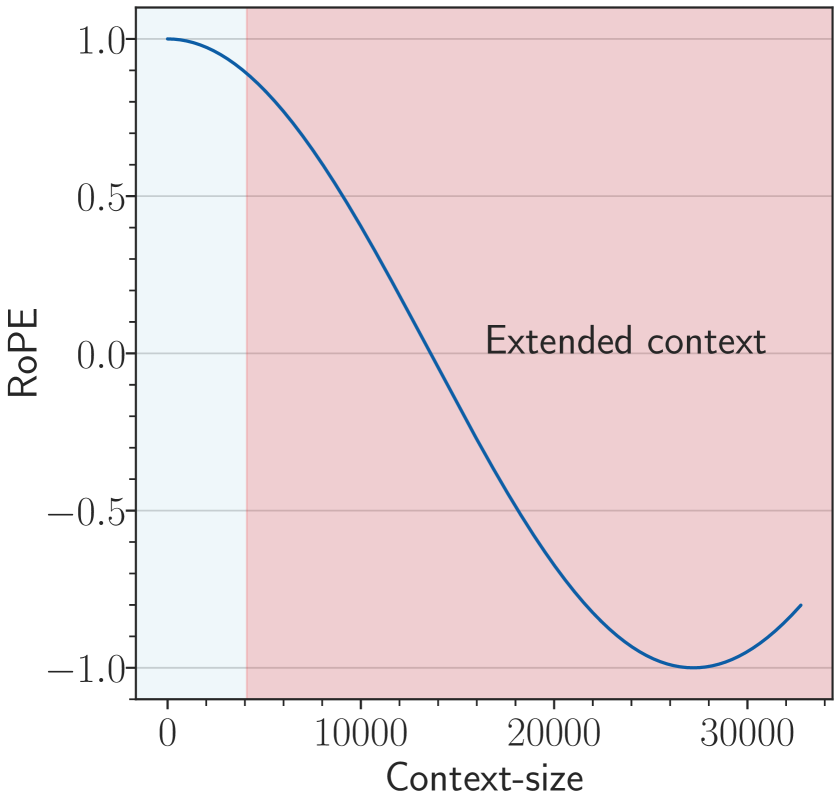
This image is a line graph illustrating the relationship between "RoPE" (Rotary Positional Embedding) values and "Context-size" in a machine learning context. The graph highlights the behavior of the embedding as the context window extends beyond its original training limits.
## 2. Component Isolation
### A. Header/Title
* No explicit title is present at the top of the image.
### B. Main Chart Area
* **Type:** 2D Line Plot with shaded background regions.
* **X-Axis (Horizontal):**
* **Label:** "Context-size"
* **Major Tick Markers:** 0, 10000, 20000, 30000.
* **Minor Tick Markers:** Increments of 2000 (e.g., 2000, 4000, 6000, 8000).
* **Y-Axis (Vertical):**
* **Label:** "RoPE"
* **Major Tick Markers:** -1.0, -0.5, 0.0, 0.5, 1.0.
* **Minor Tick Markers:** Increments of 0.1.
* **Gridlines:** Horizontal grey lines are present at y-values: -1.0, -0.5, 0.0, 0.5, 1.0.
### C. Shaded Regions (Background)
* **Light Blue Region:** Extends from x = 0 to approximately x = 4000. This represents the "standard" or "original" context window.
* **Light Red/Pink Region:** Extends from approximately x = 4000 to the end of the x-axis (approx. 33000).
* **Embedded Text:** "Extended context" is centered within this region at roughly [x=23000, y=0.05].
## 3. Data Series Analysis
### Trend Verification
* **Series:** Single dark blue solid line.
* **Visual Trend:** The line follows a sinusoidal (specifically, a cosine-like) curve. It starts at its maximum value at x=0, slopes downward through the x-axis, reaches a minimum, and begins to slope upward again at the far right of the chart.
### Data Point Extraction (Estimated)
| Context-size (x) | RoPE Value (y) | Region |
| :--- | :--- | :--- |
| 0 | 1.0 | Standard (Blue) |
| 4000 | ~0.9 | Boundary |
| 10000 | ~0.5 | Extended (Red) |
| 14000 | 0.0 | Extended (Red) |
| 20000 | ~-0.6 | Extended (Red) |
| 27000 | -1.0 (Local Minimum) | Extended (Red) |
| 33000 | ~-0.8 | Extended (Red) |
## 4. Technical Summary
The chart visualizes how a specific dimension of a Rotary Positional Embedding (RoPE) oscillates as the sequence length (Context-size) increases.
1. **Standard Context:** Within the first 4,000 tokens (blue area), the RoPE value remains high (between 1.0 and 0.9), indicating high correlation or specific positional encoding for short-range dependencies.
2. **Extended Context:** As the context size enters the "Extended context" zone (red area), the value crosses zero at approximately 14,000 tokens and reaches a full phase inversion (-1.0) at approximately 27,000 tokens.
This visualization is typically used to demonstrate the "out-of-distribution" behavior of positional embeddings when a model is pushed beyond the sequence length it was originally trained on, showing the periodic nature of the encoding mechanism.