## Bar Chart: Frequency of Actions
### Overview
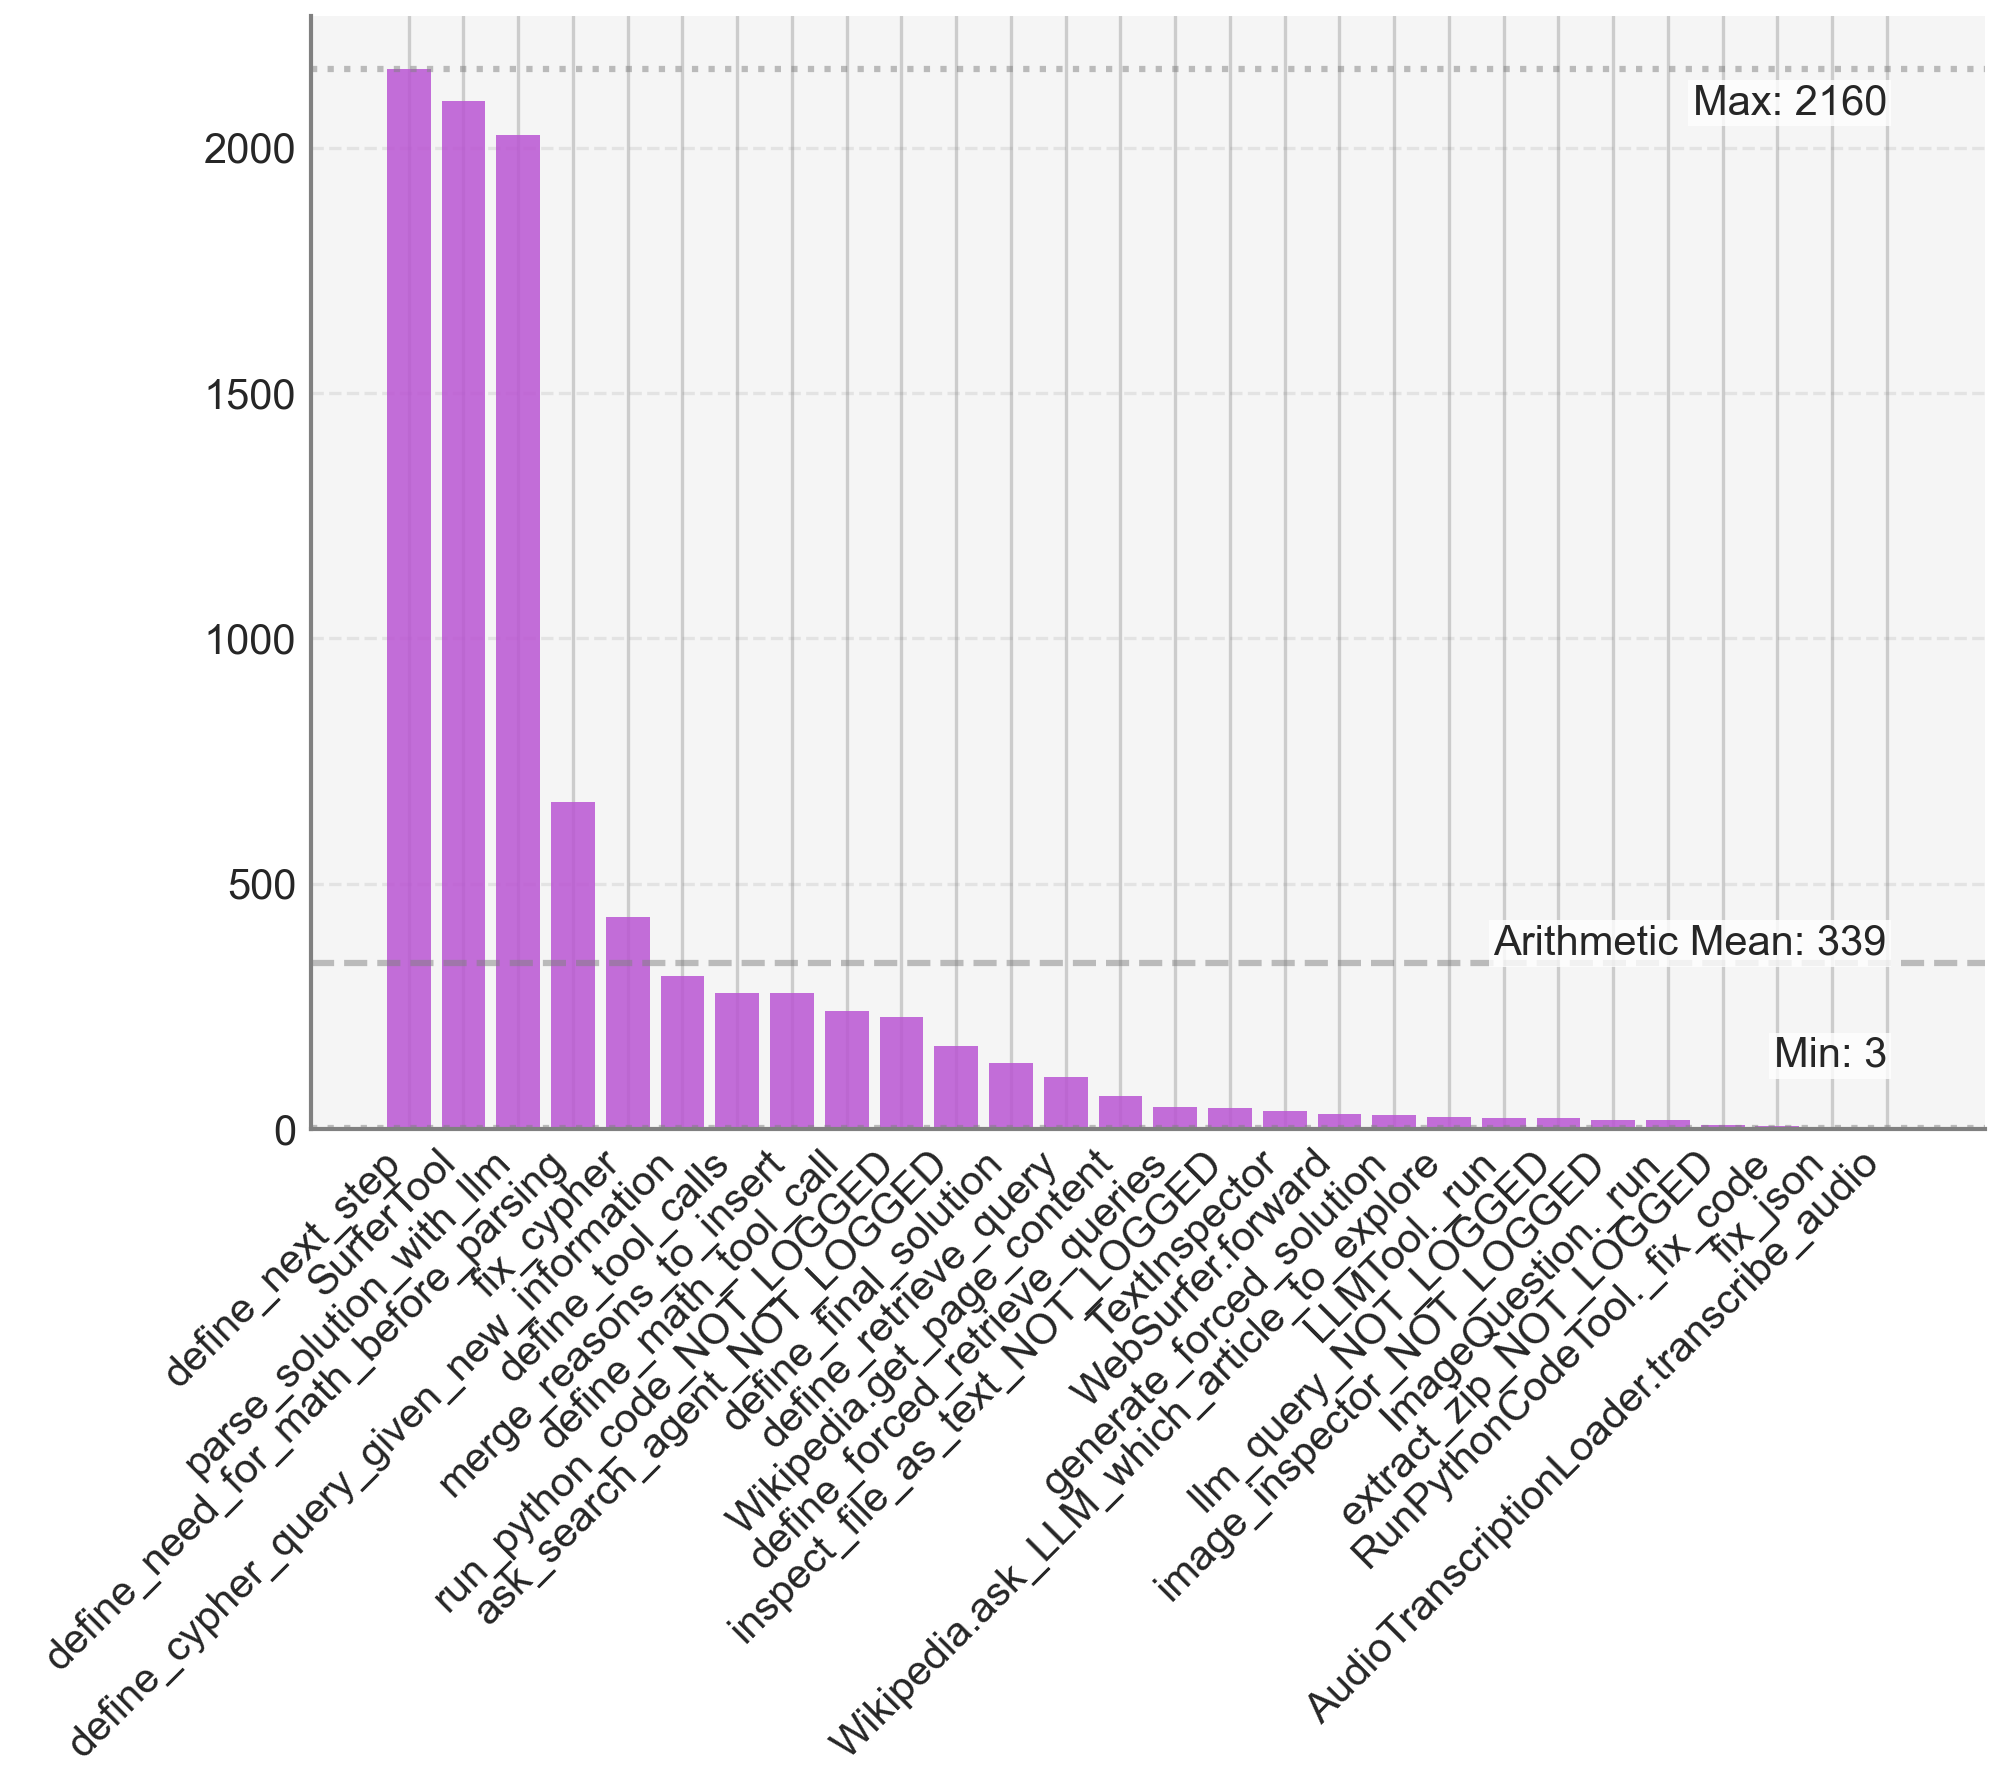
The image is a bar chart displaying the frequency of different actions. The x-axis lists the actions, and the y-axis represents the count or frequency of each action. The bars are colored in purple. The chart also includes horizontal lines indicating the arithmetic mean, maximum, and minimum values.
### Components/Axes
* **X-axis:** Lists various actions, including "define\_next\_step", "SurferTool", "parse\_solution\_with\_llm", "define\_need\_for\_math\_before\_parsing", "fix\_cypher", "define\_cypher\_query\_given\_new\_information", "merge\_reasons\_to\_insert", "define\_math\_tool\_call", "define tool calls", "ask\_search\_agent\_NOT\_LOGGED", "run\_python\_code\_NOT LOGGED", "define\_final\_solution", "define\_retrieve\_query", "Wikipedia.get\_page\_content", "define\_forced\_retrieve\_queries", "inspect\_file\_as\_text\_NOT\_LOGGED", "Wikipedia.ask\_LLM\_which\_article", "generate\_forced\_solution", "WebSurfer.forward", "TextInspector", "Ilm\_which\_article\_to\_explore", "IlmTool.\_run", "Ilm\_query\_NOT\_LOGGED", "image\_inspector\_NOT\_LOGGED", "Image Question. run", "extract\_zip\_NOT\_LOGGED", "RunPython Code Tool.\_fix\_code", "fix\_json", "Audio TranscriptionLoader.transcribe\_audio". The labels are rotated to fit.
* **Y-axis:** Numerical scale ranging from 0 to 2000, with increments of 500.
* **Bars:** Purple bars representing the frequency of each action.
* **Horizontal Lines:**
* Dashed line at approximately y=339, labeled "Arithmetic Mean: 339".
* Dashed line at approximately y=2160, labeled "Max: 2160".
* **Minimum Value:** "Min: 3" is indicated near the bottom-right of the chart.
### Detailed Analysis
The bar chart shows a clear distribution of action frequencies.
* **Top Actions:** The most frequent actions are "define\_next\_step", "SurferTool", and "parse\_solution\_with\_llm", with frequencies around 2100, 2080, and 2030 respectively.
* **Mid-Range Actions:** Actions like "fix\_cypher", "define\_cypher\_query\_given\_new\_information", "merge\_reasons\_to\_insert", "define\_math\_tool\_call", and "define tool calls" have frequencies between approximately 300 and 700.
* **Low-Frequency Actions:** Many actions have very low frequencies, close to the minimum value of 3. These include "Wikipedia.ask\_LLM\_which\_article", "generate\_forced\_solution", "WebSurfer.forward", "TextInspector", "Ilm\_which\_article\_to\_explore", "IlmTool.\_run", "Ilm\_query\_NOT\_LOGGED", "image\_inspector\_NOT\_LOGGED", "Image Question. run", "extract\_zip\_NOT\_LOGGED", "RunPython Code Tool.\_fix\_code", "fix\_json", and "Audio TranscriptionLoader.transcribe\_audio".
Specific data points (approximate due to visual estimation):
* define\_next\_step: ~2100
* SurferTool: ~2080
* parse\_solution\_with\_llm: ~2030
* define\_need\_for\_math\_before\_parsing: ~700
* fix\_cypher: ~650
* define\_cypher\_query\_given\_new\_information: ~400
* merge\_reasons\_to\_insert: ~300
* define\_math\_tool\_call: ~280
* define tool calls: ~270
* ask\_search\_agent\_NOT\_LOGGED: ~250
* run\_python\_code\_NOT LOGGED: ~240
* define\_final\_solution: ~200
* define\_retrieve\_query: ~150
* Wikipedia.get\_page\_content: ~120
* define\_forced\_retrieve\_queries: ~90
* inspect\_file\_as\_text\_NOT\_LOGGED: ~70
* Wikipedia.ask\_LLM\_which\_article: ~40
* generate\_forced\_solution: ~30
* WebSurfer.forward: ~25
* TextInspector: ~20
* Ilm\_which\_article\_to\_explore: ~15
* IlmTool.\_run: ~12
* Ilm\_query\_NOT\_LOGGED: ~10
* image\_inspector\_NOT\_LOGGED: ~8
* Image Question. run: ~7
* extract\_zip\_NOT\_LOGGED: ~6
* RunPython Code Tool.\_fix\_code: ~5
* fix\_json: ~4
* Audio TranscriptionLoader.transcribe\_audio: ~3
### Key Observations
* The top three actions are significantly more frequent than all other actions.
* There is a long tail of actions with very low frequencies.
* The arithmetic mean is 339, but most actions have frequencies below this value, indicating a skewed distribution.
* Several actions are marked with "NOT LOGGED", suggesting that data logging might be incomplete or inconsistent for these actions.
### Interpretation
The data suggests that certain initial steps ("define\_next\_step", "SurferTool", "parse\_solution\_with\_llm") are heavily used, possibly indicating core functionalities or common starting points in a workflow. The long tail of less frequent actions could represent more specialized or less common tasks. The "NOT LOGGED" labels raise questions about the completeness and reliability of the data for those specific actions. The skewed distribution highlights that a few actions dominate the overall usage, while many others are used infrequently. This information could be valuable for optimizing workflows, prioritizing development efforts, and improving data logging practices.