\n
## Bar Chart: Tool Call Frequency
### Overview
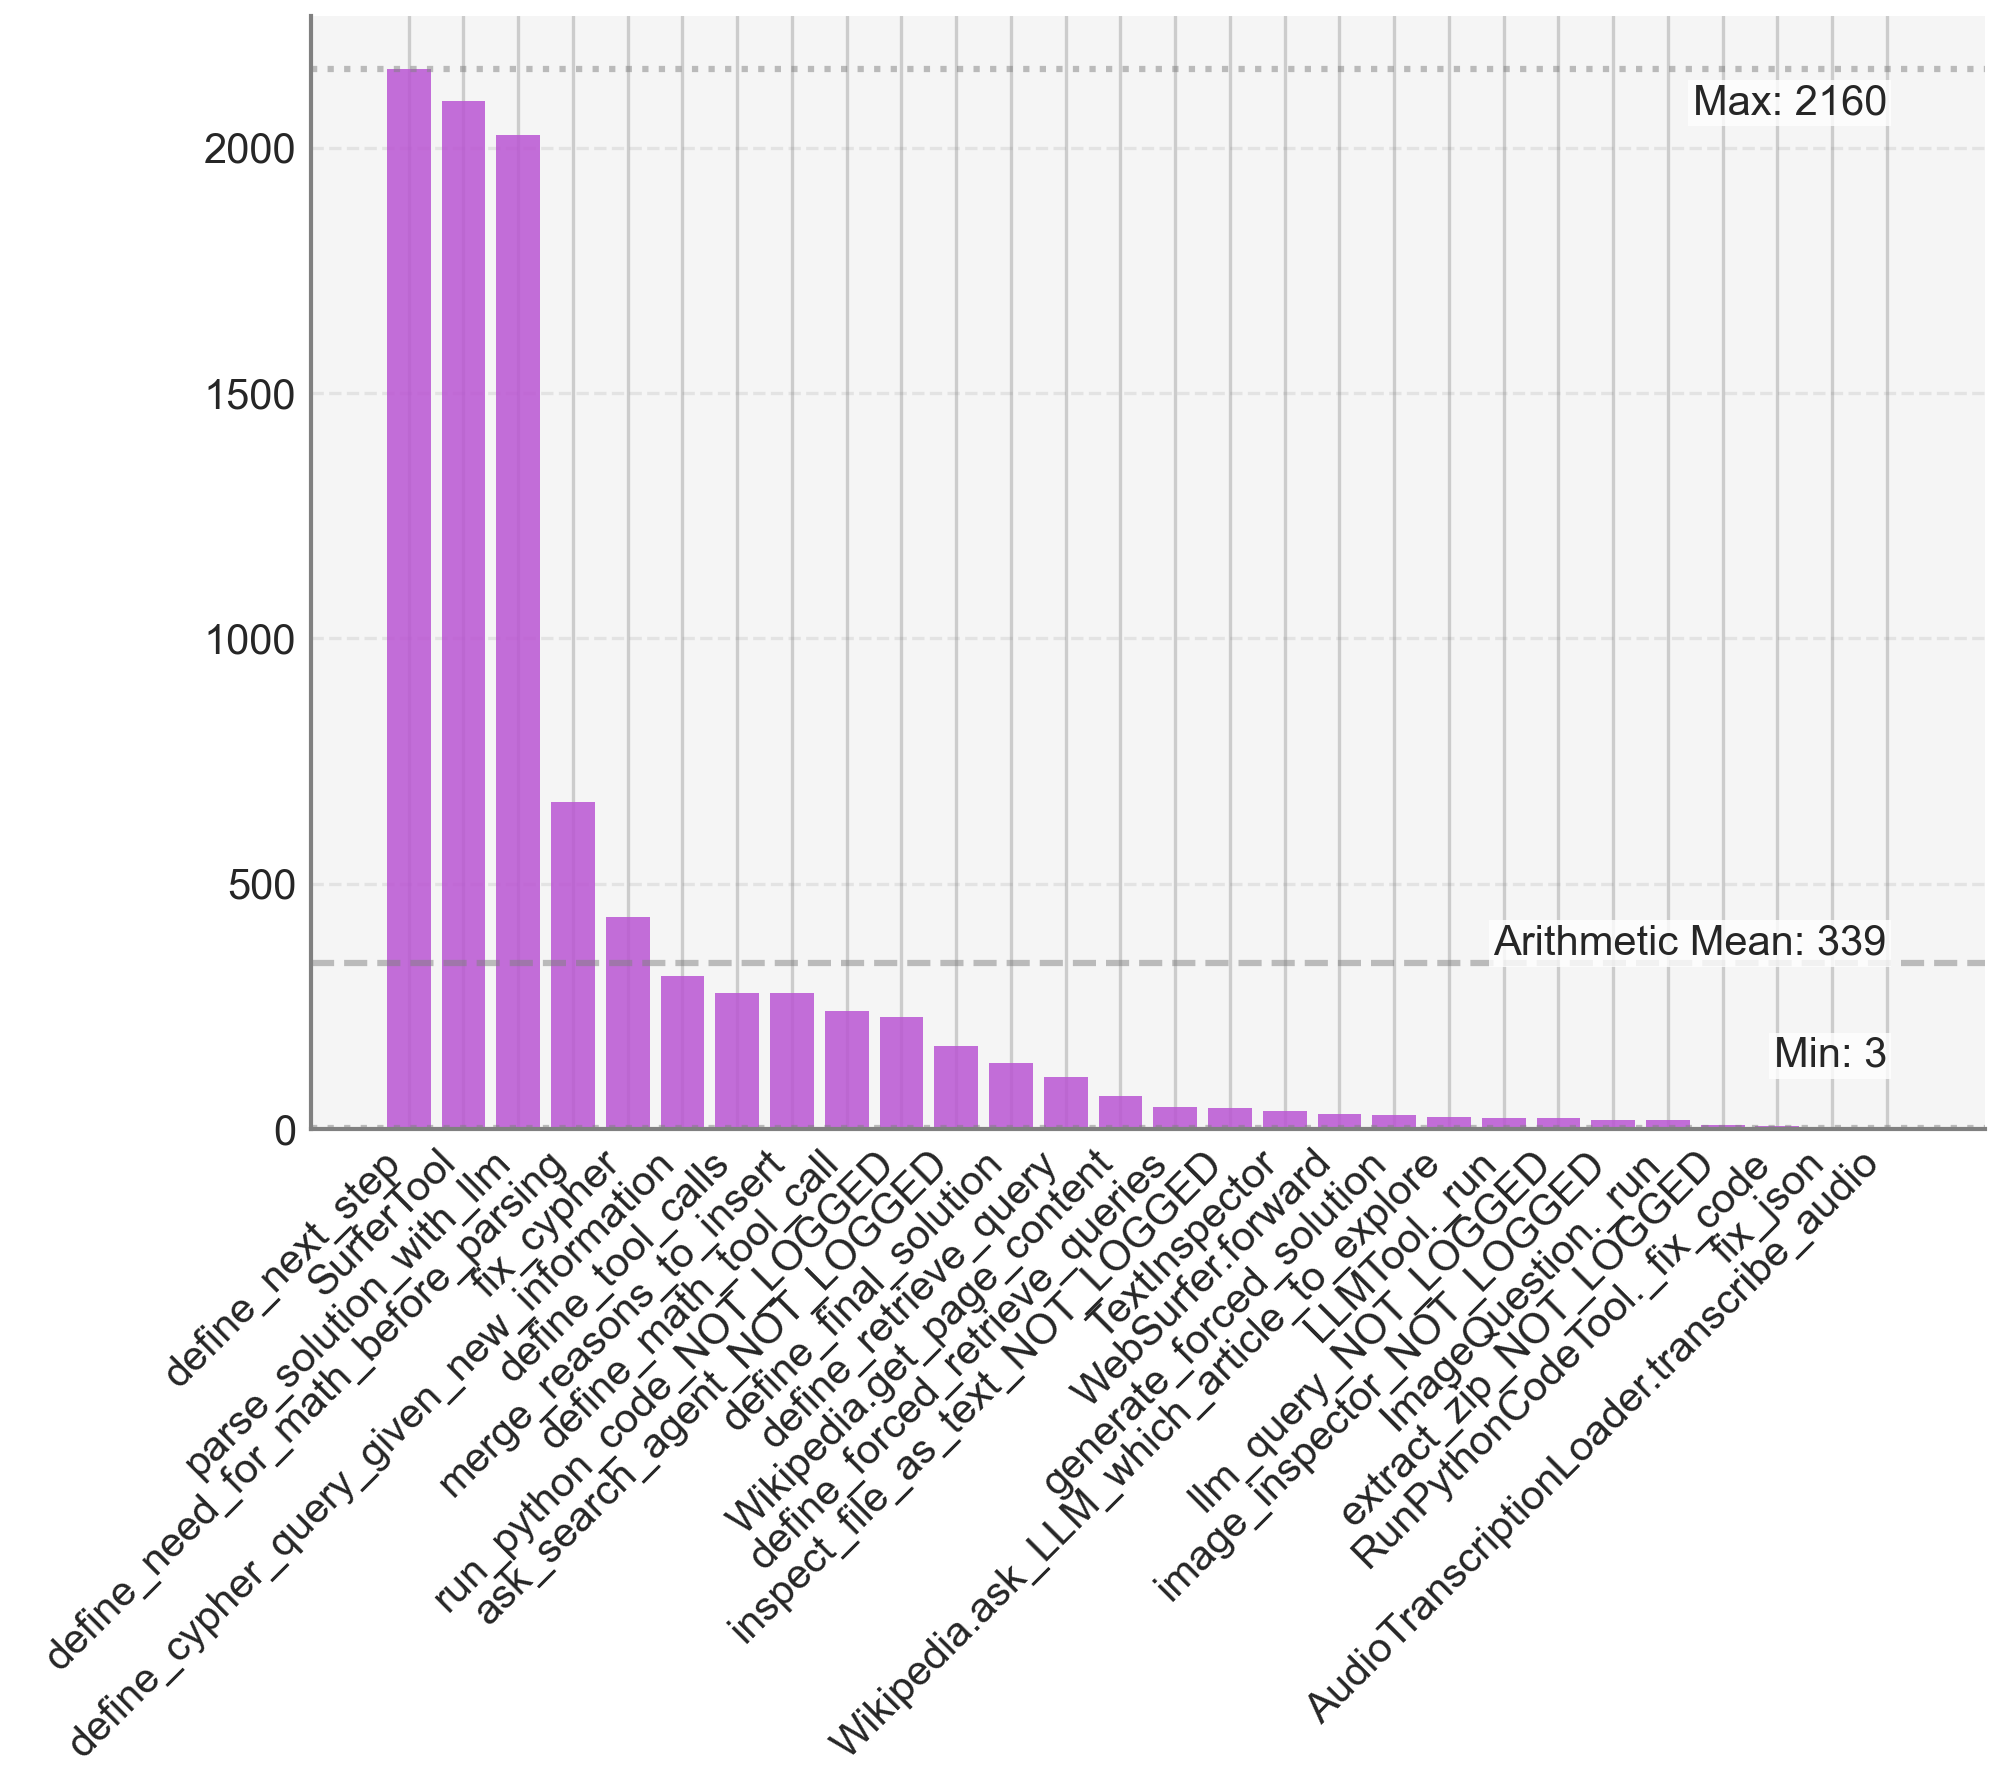
The image presents a bar chart illustrating the frequency of calls to various tools. The x-axis lists the tool names, and the y-axis represents the number of times each tool was called. The chart displays a significant variation in tool call frequencies, with some tools being called much more often than others.
### Components/Axes
* **X-axis Label:** Tool Name
* **Y-axis Label:** Frequency (Implied, no explicit label)
* **Y-axis Scale:** 0 to 2160, with increments of 250.
* **Data Series:** Single series representing the frequency of each tool call.
* **Annotations:**
* "Max: 2160" – Located at the top-right corner.
* "Arithmetic Mean: 339" – Located at the top-right corner.
* "Min: 3" – Located at the top-right corner.
* **Tool Categories (X-axis):**
* `define_next_step`
* `define_need_for_math_before_llm`
* `parse_solution_parsing`
* `define_cipher_query_given_new_fix_cipher`
* `merge_reason_for_tool_calls`
* `define_math_tool_call`
* `run_python_code_NOT_LOGGED`
* `ask_search_agent_NOT_LOGGED`
* `define_final_solution`
* `Wikipedia_det_pace_query`
* `define_retrieve_content`
* `Wikipedia_ask_LLM_generate_article`
* `WebSurfer_forward`
* `TextInspector_solution`
* `ilm_query_NOT_LOGGED`
* `LLMTool_run`
* `image_inspect_question_NOT_LOGGED`
* `extract_zincQuestion_run`
* `RunpythonCodeTool_fix_code`
* `AudioTranscriptionLoader_transcribe_audio`
### Detailed Analysis
The chart shows a decreasing trend in tool call frequency as we move from left to right.
* `define_next_step`: Approximately 2100 calls. (Purple bar, tallest)
* `define_need_for_math_before_llm`: Approximately 2050 calls. (Purple bar, second tallest)
* `parse_solution_parsing`: Approximately 1900 calls. (Purple bar)
* `define_cipher_query_given_new_fix_cipher`: Approximately 1750 calls. (Purple bar)
* `merge_reason_for_tool_calls`: Approximately 1600 calls. (Purple bar)
* `define_math_tool_call`: Approximately 1400 calls. (Purple bar)
* `run_python_code_NOT_LOGGED`: Approximately 1200 calls. (Purple bar)
* `ask_search_agent_NOT_LOGGED`: Approximately 1100 calls. (Purple bar)
* `define_final_solution`: Approximately 950 calls. (Purple bar)
* `Wikipedia_det_pace_query`: Approximately 800 calls. (Purple bar)
* `define_retrieve_content`: Approximately 700 calls. (Purple bar)
* `Wikipedia_ask_LLM_generate_article`: Approximately 600 calls. (Purple bar)
* `WebSurfer_forward`: Approximately 500 calls. (Purple bar)
* `TextInspector_solution`: Approximately 400 calls. (Purple bar)
* `ilm_query_NOT_LOGGED`: Approximately 350 calls. (Purple bar)
* `LLMTool_run`: Approximately 300 calls. (Purple bar)
* `image_inspect_question_NOT_LOGGED`: Approximately 200 calls. (Purple bar)
* `extract_zincQuestion_run`: Approximately 100 calls. (Purple bar)
* `RunpythonCodeTool_fix_code`: Approximately 50 calls. (Purple bar)
* `AudioTranscriptionLoader_transcribe_audio`: Approximately 3 calls. (Purple bar, shortest)
### Key Observations
* The tool `define_next_step` is called significantly more often than any other tool.
* The tool `AudioTranscriptionLoader_transcribe_audio` is called very rarely.
* The majority of tools are called between 500 and 1500 times.
* The arithmetic mean (339) is lower than the median, suggesting a skewed distribution with a few tools having very high call counts.
### Interpretation
The chart demonstrates a clear hierarchy in tool usage. The tools `define_next_step` and `define_need_for_math_before_llm` appear to be fundamental to the process being monitored, as they are called far more frequently than others. The low call count for `AudioTranscriptionLoader_transcribe_audio` suggests that audio transcription is a relatively infrequent requirement in this workflow. The "NOT_LOGGED" tools may indicate that these calls are not being tracked or are occurring outside of the monitored system. The large difference between the mean and the maximum value indicates that a small number of tools account for a large proportion of the total tool calls. This data could be used to optimize the system by focusing on the most frequently used tools or investigating why certain tools are rarely used. The chart provides insights into the operational characteristics of a system that relies on a suite of tools, highlighting which tools are critical and which may be candidates for improvement or removal.