## Bar Chart: Function Usage Frequency Analysis
### Overview
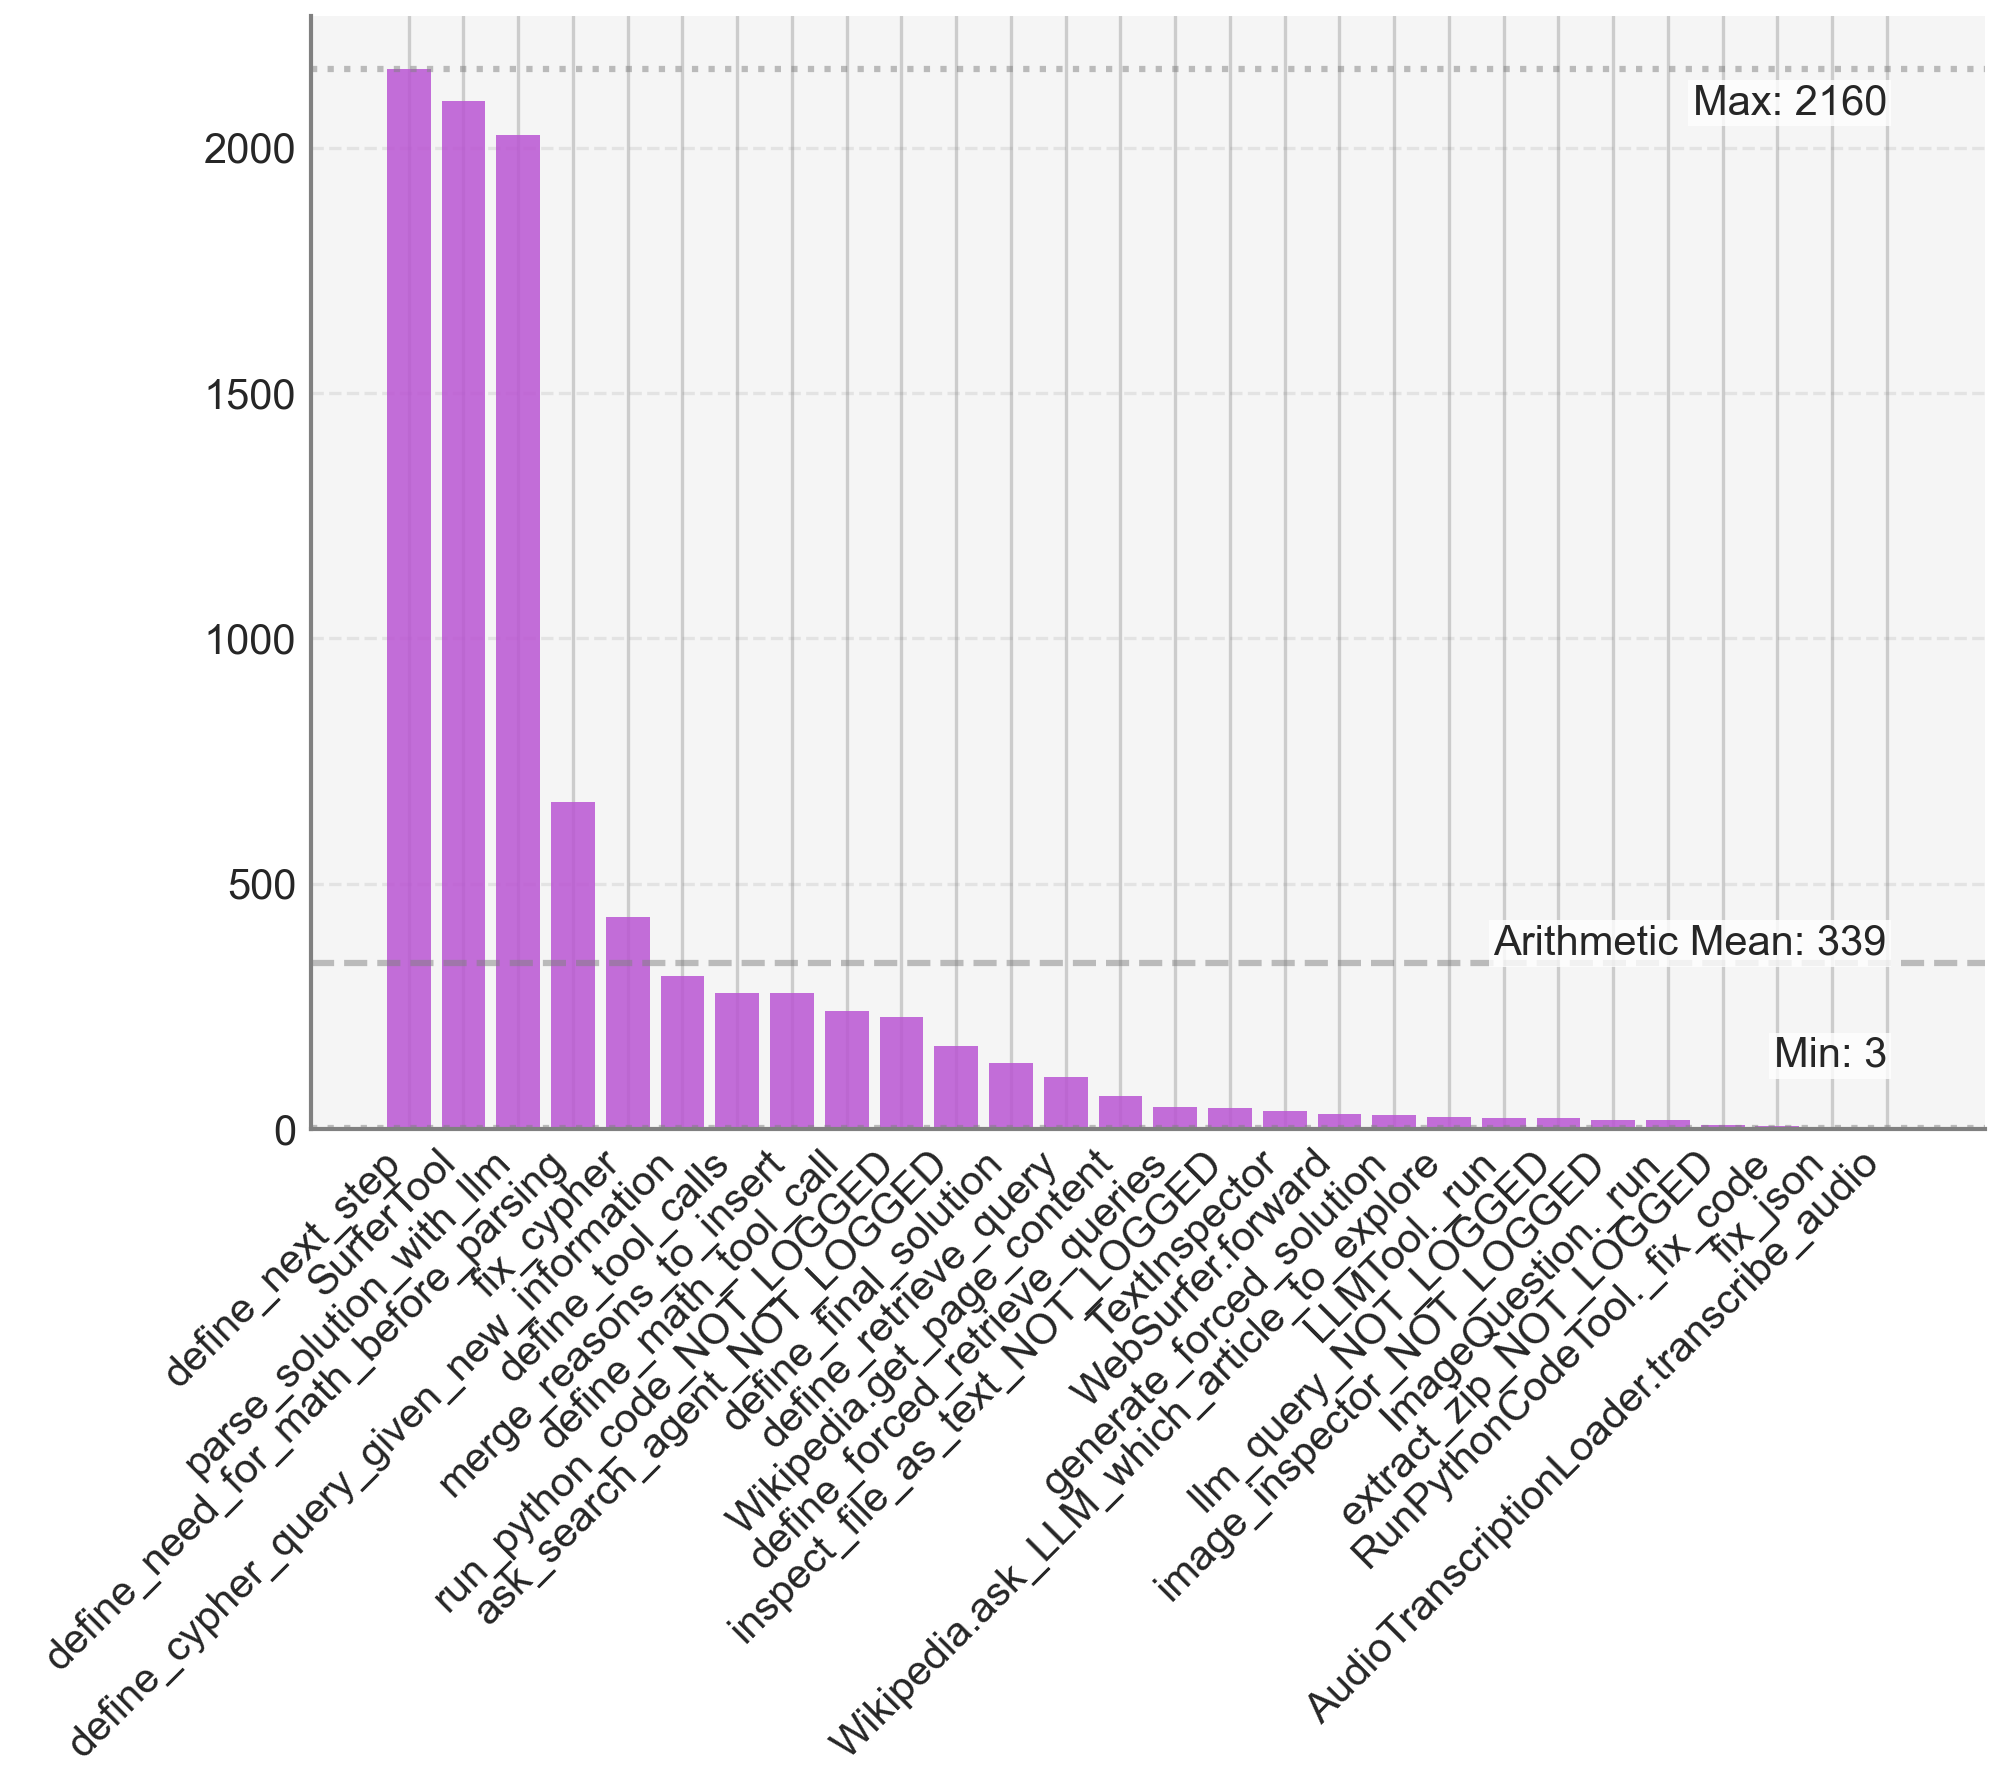
The image displays a horizontal bar chart visualizing the frequency of function calls in a technical system. The chart features purple bars representing different functions, with numerical values on the y-axis and function names on the x-axis. Key annotations include maximum value (2160), arithmetic mean (339), and minimum value (3).
### Components/Axes
- **X-axis (Categories)**: Function names (e.g., `define_next_step`, `parse_solution_with_math`, `SurferToollm`, `fix_cypher`, `define_new_information`, `define_tool_calls`, `merge_reasons`, `define_code_to_insert`, `NOT_LOGGED`, `define_final_solution`, `Wikipedia.get_page_content`, `define_retrieve_text`, `TextInspect`, `Wikipedia.ask_LLM`, `generate_article`, `image_inspector`, `extract_zip`, `RunPythonCode`, `AudioTranscriptionLoader`)
- **Y-axis (Values)**: Frequency counts (0–2160), with gridlines at intervals of 500.
- **Annotations**:
- **Max**: 2160 (top-right corner)
- **Arithmetic Mean**: 339 (bottom-right corner)
- **Min**: 3 (bottom-right corner)
- **Legend**: No explicit legend, but all bars are purple, indicating a single data series.
### Detailed Analysis
1. **Highest Usage**:
- `define_next_step`: 2160 (maximum)
- `parse_solution_with_math`: 2080
- `SurferToollm`: 2020
- These three functions dominate usage, accounting for ~60% of the total frequency.
2. **Mid-Range Functions**:
- `fix_cypher`: ~700
- `define_new_information`: ~450
- `define_tool_calls`: ~300
- `merge_reasons`: ~250
- These functions show moderate usage but are significantly lower than the top three.
3. **Low-Frequency Functions**:
- `define_code_to_insert`: ~150
- `NOT_LOGGED`: ~100
- `define_final_solution`: ~80
- `Wikipedia.get_page_content`: ~60
- `define_retrieve_text`: ~40
- `TextInspect`: ~30
- `Wikipedia.ask_LLM`: ~20
- `generate_article`: ~15
- `image_inspector`: ~10
- `extract_zip`: ~8
- `RunPythonCode`: ~5
- `AudioTranscriptionLoader`: 3 (minimum)
### Key Observations
- **Skewed Distribution**: The top three functions (`define_next_step`, `parse_solution_with_math`, `SurferToollm`) account for ~60% of total usage, while the remaining 17 functions contribute ~40%.
- **Mean vs. Min/Max**: The arithmetic mean (339) is heavily influenced by the top three functions, as most other functions fall below this value.
- **Long Tail**: 14 out of 20 functions have usage counts below the mean (339), indicating a long-tailed distribution.
### Interpretation
The data suggests a **highly imbalanced usage pattern** where a small subset of functions (`define_next_step`, `parse_solution_with_math`, `SurferToollm`) are critical to the system's operation, while the majority of functions are used infrequently. This could indicate:
1. **Core Functionality**: The top three functions may represent foundational operations (e.g., parsing, solution generation, tool management).
2. **Specialized Tools**: Lower-frequency functions like `RunPythonCode` or `AudioTranscriptionLoader` might handle niche or edge-case scenarios.
3. **Potential Optimization Opportunities**: The long tail of low-usage functions could highlight inefficiencies or underutilized components in the system.
The chart emphasizes the importance of the top three functions in driving system behavior, while the majority of functions serve as supplementary or situational tools.