## Line Graph: Logical Relationship Between Patterns and Regions (p = 0.83, r = 0.89)
### Overview
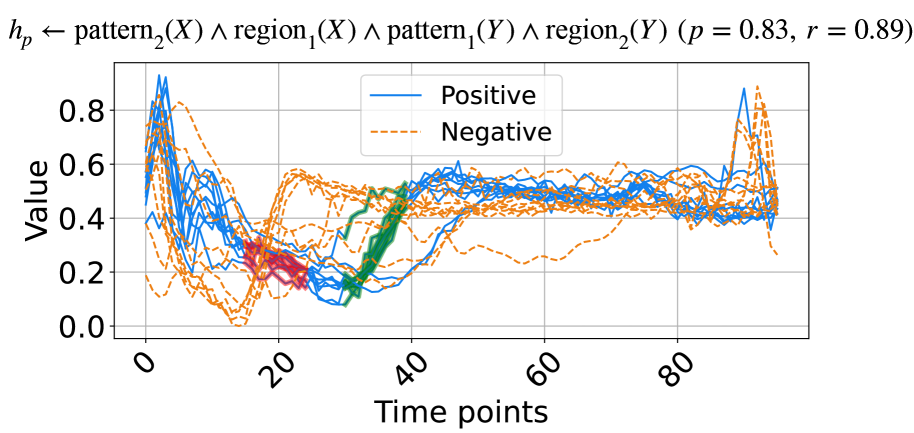
The image depicts a line graph comparing two time-series datasets labeled "Positive" (solid blue line) and "Negative" (dashed orange line). The graph spans 80 time points on the x-axis and values between 0.0 and 0.8 on the y-axis. The title includes a logical expression involving pattern/region relationships with statistical metrics (p = 0.83, r = 0.89).
### Components/Axes
- **X-axis**: "Time points" (0–80, linear scale)
- **Y-axis**: "Value" (0.0–0.8, linear scale)
- **Legend**: Located in the top-right corner, with:
- Solid blue line: "Positive"
- Dashed orange line: "Negative"
- **Title**: Positioned at the top, containing a logical formula:
`h_p ← pattern₂(X) ∧ region₁(X) ∧ pattern₁(Y) ∧ region₂(Y) (p = 0.83, r = 0.89)`
### Detailed Analysis
1. **Positive (Blue Line)**:
- Starts at ~0.75 at time point 0.
- Drops sharply to ~0.2 by time point 10.
- Rises to ~0.6 by time point 20, then fluctuates between 0.4–0.6 until time point 40.
- Peaks at ~0.8 at time point 80.
2. **Negative (Orange Line)**:
- Begins at ~0.3 at time point 0.
- Rises to ~0.5 by time point 20, then stabilizes between 0.4–0.5 until time point 60.
- Spikes to ~0.7 at time point 80.
3. **Intersection**: The lines cross near time point 20, where the blue line dips below the orange line before diverging again.
### Key Observations
- **Correlation**: The high r-value (0.89) suggests a strong positive correlation between the two datasets.
- **Divergence**: The datasets diverge significantly after time point 20, with the "Positive" line showing greater volatility.
- **Outlier**: The "Negative" line's sharp spike at time point 80 deviates from its earlier stability.
### Interpretation
The graph illustrates a dynamic relationship between two variables over time, with the "Positive" dataset exhibiting higher initial values and greater variability, while the "Negative" dataset remains more stable until the final time point. The logical expression in the title implies that the observed correlation (r = 0.89) supports a combined pattern-region relationship, though the p-value (0.83) suggests this relationship is not statistically significant at conventional thresholds (e.g., p < 0.05). The divergence at time point 80 may indicate an external factor influencing the "Negative" dataset. The strong correlation coefficient implies that the two variables are closely related, but the lack of statistical significance in the p-value warrants caution in drawing definitive conclusions.