## Directed Graph Diagram: Educational and Demographic Relationships
### Overview
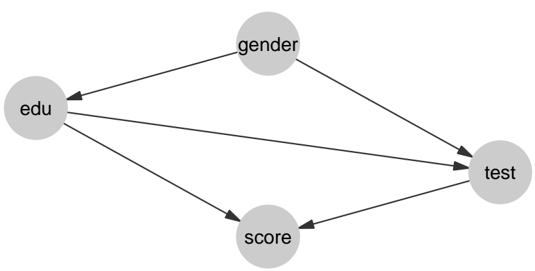
The image depicts a directed graph with four nodes representing variables: "edu" (education), "gender", "score", and "test". Arrows indicate directional relationships between these variables, suggesting a model of influence or dependency.
### Components/Axes
- **Nodes**:
- `edu` (top-left)
- `gender` (top-center)
- `score` (bottom-center)
- `test` (bottom-right)
- **Edges** (directed arrows):
- `edu` → `gender`
- `edu` → `score`
- `edu` → `test`
- `gender` → `test`
- `score` → `test`
### Detailed Analysis
- **Node Connections**:
- `edu` has three outgoing edges, indicating it influences all other variables.
- `gender` and `score` each have one outgoing edge to `test`, suggesting they act as intermediaries.
- `test` has no outgoing edges, positioning it as a terminal outcome variable.
- **Pathways**:
- Two indirect pathways from `edu` to `test`: `edu` → `gender` → `test` and `edu` → `score` → `test`.
- One direct pathway: `edu` → `test`.
### Key Observations
1. **Central Role of `edu`**: Education is the primary driver, directly and indirectly affecting all other variables.
2. **Mediating Variables**: `gender` and `score` partially mediate the relationship between `edu` and `test`.
3. **Direct Effect**: The direct link from `edu` to `test` implies a residual effect of education on test performance independent of gender and score.
### Interpretation
This diagram likely represents a structural model in educational research, where:
- **Education (`edu`)** is hypothesized to impact test performance (`test`) through both direct and indirect mechanisms.
- **Gender** and **score** act as mediators, suggesting that education's effect on test outcomes may be filtered through demographic factors and prior academic performance.
- The direct edge from `edu` to `test` highlights that even after accounting for gender and score, education retains a significant influence on test results. This could imply that factors like teaching quality, curriculum, or institutional resources (captured by `edu`) have an intrinsic impact on test performance beyond demographic or intermediate variables.
The model emphasizes the complexity of educational outcomes, where multiple pathways interact to shape results. Further analysis (e.g., regression coefficients) would quantify the strength of these relationships.