## Diagram: Causal Diagram
### Overview
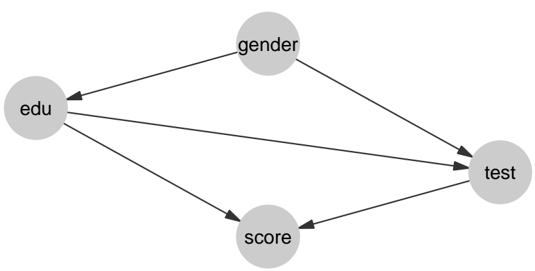
The image is a causal diagram illustrating the relationships between several variables: education ("edu"), gender, score, and test. The diagram uses nodes (circles) to represent variables and directed edges (arrows) to represent causal relationships.
### Components/Axes
* **Nodes:**
* edu (education) - Located on the left side of the diagram.
* gender - Located at the top-center of the diagram.
* score - Located at the bottom-center of the diagram.
* test - Located on the right side of the diagram.
* **Edges (Arrows):**
* edu -> test
* edu -> score
* gender -> edu
* gender -> test
* score -> test
### Detailed Analysis
The diagram shows the following causal relationships:
* Education ("edu") directly influences both the "test" and "score".
* Gender directly influences both "edu" and "test".
* Score directly influences "test".
### Key Observations
* "Test" is influenced by all other variables (edu, gender, score).
* "Edu" is influenced by "gender".
* "Score" is influenced by "edu".
* "Gender" is an independent variable in this diagram.
### Interpretation
The causal diagram suggests a model where gender influences education, and both gender and education influence test performance. Additionally, education influences a score, which in turn influences test performance. This implies that gender has both a direct and indirect (through education and score) effect on test performance. The diagram is a simplified representation of potential causal relationships and does not imply the strength or direction of these effects.