\n
## Diagram: Causal Relationship Network
### Overview
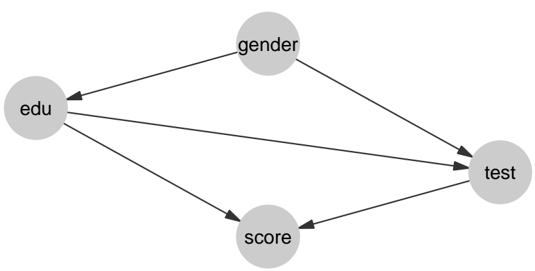
The image depicts a directed acyclic graph illustrating potential causal relationships between four variables: "edu", "gender", "test", and "score". The diagram uses circles to represent variables and arrows to indicate the direction of influence.
### Components/Axes
The diagram consists of four nodes labeled as follows:
* **edu**: Located on the left side of the diagram.
* **gender**: Located towards the top-center of the diagram.
* **test**: Located on the right side of the diagram.
* **score**: Located towards the bottom-center of the diagram.
Arrows connect these nodes, indicating hypothesized causal relationships. There are no axes or scales present.
### Detailed Analysis or Content Details
The following relationships are depicted:
1. **edu -> gender**: An arrow points from "edu" to "gender", suggesting education may influence gender (or the perception/reporting of it).
2. **edu -> test**: An arrow points from "edu" to "test", suggesting education influences test performance.
3. **gender -> test**: An arrow points from "gender" to "test", suggesting gender influences test performance.
4. **edu -> score**: An arrow points from "edu" to "score", suggesting education influences score.
5. **test -> score**: An arrow points from "test" to "score", suggesting test performance influences score.
### Key Observations
The diagram suggests a model where both education and gender directly influence test performance, and test performance directly influences the final score. Education also appears to have a direct influence on the score, independent of test performance. The relationship between education and gender is less conventional and may represent a confounding variable or a specific research hypothesis.
### Interpretation
This diagram represents a hypothesized causal model, likely used in statistical modeling or causal inference. The relationships are not necessarily proven, but rather represent assumptions about how these variables interact. The model suggests that to understand the score, one must consider the effects of both education and gender, as well as their influence on test performance. The inclusion of the "edu -> gender" link is unusual and warrants further investigation into the specific context of this model. It could represent a situation where educational attainment influences how individuals identify or are categorized by gender, or it could be a variable included to control for potential confounding effects. The diagram is a simplified representation of a complex system and does not account for other potential variables or interactions.