## Directed Acyclic Graph (DAG): Variable Influence Model
### Overview
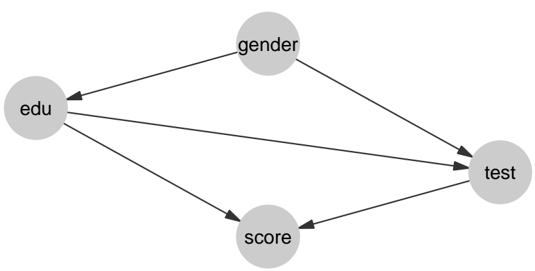
The image displays a directed acyclic graph (DAG) or influence diagram, illustrating hypothesized causal relationships between four variables. The diagram consists of four circular nodes connected by directional arrows, indicating the flow of influence or causation from one variable to another. There are no numerical data, scales, or legends present; the information is purely structural and relational.
### Components/Axes
The diagram contains four labeled nodes and five directional edges (arrows).
**Nodes (Variables):**
1. **gender**: Positioned at the top-center of the diagram.
2. **edu** (likely abbreviation for "education"): Positioned at the center-left.
3. **test**: Positioned at the center-right.
4. **score**: Positioned at the bottom-center.
**Edges (Directional Relationships):**
The arrows indicate the following directed relationships:
* From **gender** to **edu**.
* From **gender** to **test**.
* From **edu** to **test**.
* From **edu** to **score**.
* From **test** to **score**.
### Detailed Analysis
The structure defines a specific network of influences:
* **gender** is an exogenous variable (no incoming arrows) that directly influences both **edu** and **test**.
* **edu** is influenced by **gender** and, in turn, directly influences both **test** and **score**.
* **test** is influenced by both **gender** and **edu**, and it directly influences **score**.
* **score** is the terminal endogenous variable, influenced directly by both **edu** and **test**.
The graph contains no cycles; all paths flow in one direction without looping back.
### Key Observations
1. **Multiple Pathways**: There are multiple pathways from the initial variable (**gender**) to the final variable (**score**):
* Direct Path: `gender → edu → score`
* Indirect Path via Test: `gender → edu → test → score`
* Direct Path via Test: `gender → test → score`
2. **Mediating Roles**: The variable **edu** acts as a mediator for the influence of **gender** on both **test** and **score**. The variable **test** acts as a mediator for the influence of both **gender** and **edu** on **score**.
3. **Convergent Influence on Score**: The **score** node is the convergence point for two direct influences: one from **edu** and one from **test**.
### Interpretation
This diagram represents a conceptual model, likely from the social sciences, education, or psychology, proposing how different factors interact to affect an outcome ("score").
* **What it Suggests**: The model posits that a person's **gender** has a foundational influence on their educational attainment (**edu**) and their performance on a specific **test**. Furthermore, educational attainment itself influences both test performance and the final score. The final **score** is not determined by gender directly in this model, but rather through the mediating effects of education and test performance.
* **Relationships**: The arrows imply a causal or predictive hypothesis. For example, the arrow from **edu** to **test** suggests that higher education leads to better test performance. The converging arrows on **score** suggest it is an outcome determined by a combination of one's education level and their performance on a specific test.
* **Notable Absence**: There is no direct arrow from **gender** to **score**. This is a significant modeling choice, implying that any observed correlation between gender and score is fully explained (or "mediated") by the included paths through education and test performance. The model asserts that gender does not have a direct, unmediated effect on the score.
* **Purpose**: Such a diagram is used to visualize assumptions for statistical analysis (e.g., structural equation modeling) or to communicate a theoretical framework about the drivers of an outcome. It helps identify which variables need to be controlled for to estimate specific causal effects (e.g., to find the direct effect of **edu** on **score**, one would need to account for **test**).