# Technical Document Extraction: Line Graph Analysis
## Image Description
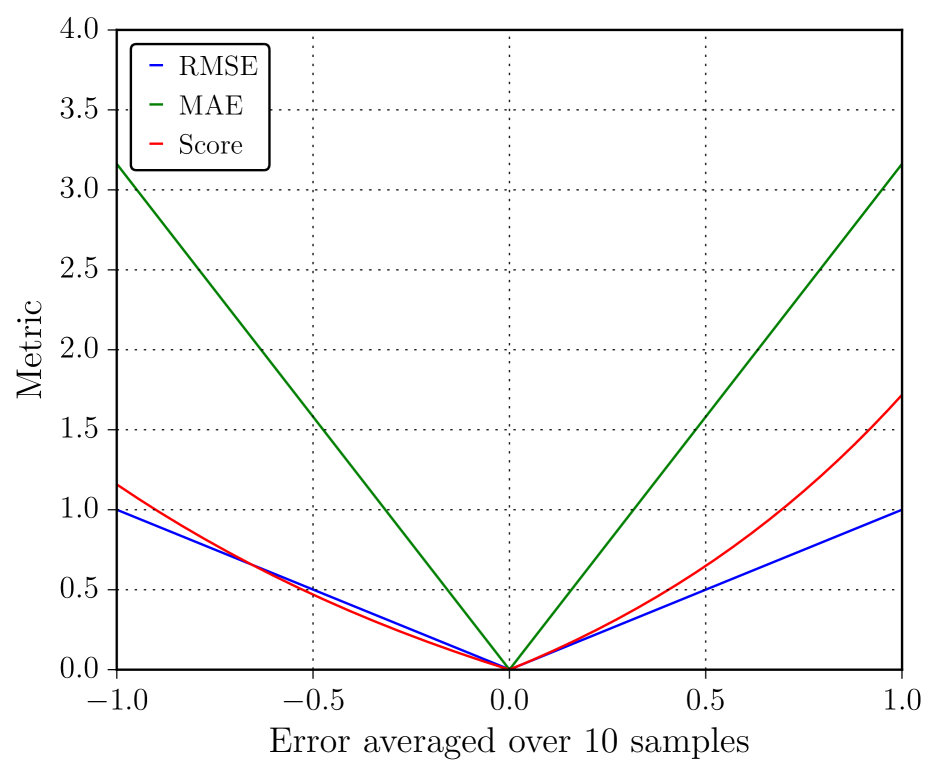
The image is a line graph depicting three metrics (RMSE, MAE, Score) plotted against an "Error averaged over 10 samples" axis. The graph includes a legend, axis labels, grid lines, and three distinct data series represented by colored lines.
---
## Labels and Axis Titles
- **X-Axis**:
- Title: *"Error averaged over 10 samples"*
- Range: -1.0 to 1.0 (in increments of 0.5)
- Tick Marks: Dotted lines at -1.0, -0.5, 0.0, 0.5, 1.0
- **Y-Axis**:
- Title: *"Metric"*
- Range: 0.0 to 4.0 (in increments of 0.5)
- Tick Marks: Dotted lines at 0.0, 0.5, 1.0, 1.5, 2.0, 2.5, 3.0, 3.5, 4.0
---
## Legend
- **Location**: Top-left corner of the graph
- **Entries**:
1. **RMSE**: Blue line
2. **MAE**: Green line
3. **Score**: Red line
---
## Data Series and Trends
### 1. **MAE (Mean Absolute Error)**
- **Color**: Green
- **Trend**:
- Starts at **3.0** when error = -1.0
- Decreases linearly to **0.0** at error = 0.0
- Increases linearly to **3.0** at error = 1.0
- **Key Points**:
- (-1.0, 3.0)
- (0.0, 0.0)
- (1.0, 3.0)
### 2. **RMSE (Root Mean Square Error)**
- **Color**: Blue
- **Trend**:
- Starts at **1.0** when error = -1.0
- Decreases linearly to **0.0** at error = 0.0
- Increases linearly to **1.0** at error = 1.0
- **Key Points**:
- (-1.0, 1.0)
- (0.0, 0.0)
- (1.0, 1.0)
### 3. **Score**
- **Color**: Red
- **Trend**:
- Starts at **1.0** when error = -1.0
- Decreases linearly to **0.0** at error = 0.0
- Increases linearly to **1.7** at error = 1.0
- **Key Points**:
- (-1.0, 1.0)
- (0.0, 0.0)
- (1.0, 1.7)
---
## Spatial Grounding and Validation
- **Legend Placement**: Top-left corner (confirmed via visual inspection).
- **Color Consistency**:
- Blue line matches "RMSE" in the legend.
- Green line matches "MAE" in the legend.
- Red line matches "Score" in the legend.
---
## Additional Observations
- The graph uses a grid of dotted lines for reference, enhancing readability.
- All data series converge at the origin (0.0, 0.0), indicating minimal error at the center.
- The MAE metric exhibits symmetry around the origin, while the Score metric shows asymmetry (higher value at error = 1.0).
---
## Conclusion
The graph illustrates how three error metrics (RMSE, MAE, Score) vary with averaged error values. MAE and RMSE are symmetric, while the Score metric shows a steeper increase for positive errors. No non-English text or additional data structures (e.g., tables) are present in the image.