## Line Charts: Performance Comparison of Different Neural Network Training Methods
### Overview
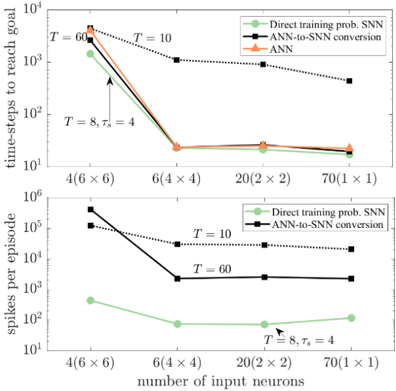
The image contains two line charts comparing the performance of different neural network training methods. The top chart shows the number of time-steps required to reach a goal, while the bottom chart shows the number of spikes per episode. Both charts compare "Direct training prob. SNN", "ANN-to-SNN conversion", and "ANN" methods across different numbers of input neurons.
### Components/Axes
**Top Chart:**
* **Title:** time-steps to reach goal
* **Y-axis:** time-steps to reach goal (Logarithmic scale, base 10). Axis markers at 10<sup>1</sup>, 10<sup>2</sup>, 10<sup>3</sup>, 10<sup>4</sup>.
* **X-axis:** number of input neurons. Axis markers at 4(6x6), 6(4x4), 20(2 x 2), 70(1 x 1).
* **Legend (Top-Right):**
* Green line with circle markers: Direct training prob. SNN
* Black dotted line with square markers: ANN-to-SNN conversion
* Orange line with triangle markers: ANN
**Bottom Chart:**
* **Title:** spikes per episode
* **Y-axis:** spikes per episode (Logarithmic scale, base 10). Axis markers at 10<sup>1</sup>, 10<sup>2</sup>, 10<sup>4</sup>, 10<sup>5</sup>, 10<sup>6</sup>.
* **X-axis:** number of input neurons. Axis markers at 4(6x6), 6(4x4), 20(2 x 2), 70(1 x 1).
* **Legend (Top-Right):**
* Green line with circle markers: Direct training prob. SNN
* Black dotted line with square markers: ANN-to-SNN conversion
### Detailed Analysis
**Top Chart: Time-steps to reach goal**
* **Direct training prob. SNN (Green):** The line starts at approximately 1200 at 4(6x6), decreases sharply to about 20 at 6(4x4), remains relatively constant at approximately 18 at 20(2x2), and then decreases slightly to approximately 15 at 70(1x1).
* **ANN-to-SNN conversion (Black, dotted):** The line starts at approximately 5000 at 4(6x6), decreases sharply to approximately 900 at 6(4x4), then decreases to approximately 25 at 20(2x2), and finally decreases to approximately 400 at 70(1x1).
* **ANN (Orange):** The line starts at approximately 2500 at 4(6x6), decreases sharply to approximately 20 at 6(4x4), remains relatively constant at approximately 20 at 20(2x2), and then decreases slightly to approximately 18 at 70(1x1).
**Bottom Chart: Spikes per episode**
* **Direct training prob. SNN (Green):** The line starts at approximately 300 at 4(6x6), decreases to approximately 80 at 6(4x4), remains relatively constant at approximately 70 at 20(2x2), and then decreases slightly to approximately 60 at 70(1x1).
* **ANN-to-SNN conversion (Black, dotted):** The line starts at approximately 500000 at 4(6x6), decreases sharply to approximately 25000 at 6(4x4), then decreases to approximately 15000 at 20(2x2), and finally decreases to approximately 10000 at 70(1x1).
### Key Observations
* In the top chart, the "Direct training prob. SNN" and "ANN" methods show similar performance, requiring significantly fewer time-steps to reach the goal compared to "ANN-to-SNN conversion" for lower numbers of input neurons. However, as the number of input neurons increases, the performance gap narrows.
* In the bottom chart, "Direct training prob. SNN" consistently requires significantly fewer spikes per episode compared to "ANN-to-SNN conversion". The difference is several orders of magnitude.
* Both charts show a general trend of decreasing time-steps/spikes per episode as the number of input neurons increases, up to a point, after which the performance plateaus or even slightly degrades.
### Interpretation
The data suggests that "Direct training prob. SNN" and "ANN" are more efficient in terms of time-steps to reach the goal, especially when the number of input neurons is low. However, "ANN-to-SNN conversion" requires significantly more spikes per episode, indicating a higher computational cost. The choice of method depends on the specific application and the trade-off between time-steps, spikes, and the number of input neurons. The annotations "T=60", "T=10", and "T = 8, τs = 4" likely refer to different parameter settings used during the training or conversion process, and their impact on performance varies depending on the method and the number of input neurons.