## Chart: Performance Comparison of SNN Training Methods
### Overview
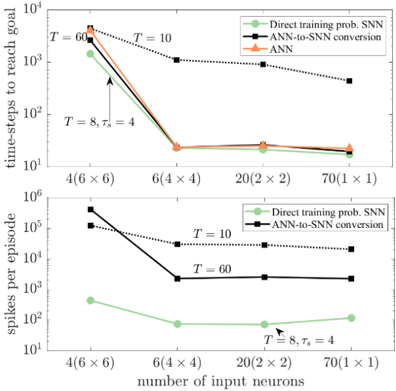
This image presents two charts comparing the performance of different Spiking Neural Network (SNN) training methods – Direct training of probabilistic SNNs and ANN-to-SNN conversion – against a standard Artificial Neural Network (ANN). The charts plot performance metrics (time-steps to reach goal and spikes per episode) against the number of input neurons. The charts are stacked vertically.
### Components/Axes
**Top Chart:**
* **Title:** Not explicitly present, but implied to be related to time-steps to reach goal.
* **X-axis:** "number of input neurons" with markers: 4(6 x 6), 6(4 x 4), 20(2 x 2), 70(1 x 1).
* **Y-axis:** "time-steps to reach goal" on a logarithmic scale, ranging from 10<sup>1</sup> to 10<sup>4</sup>.
* **Legend:** Located in the top-right corner.
* Green Line: "Direct training prob. SNN"
* Black Line: "ANN-to-SNN conversion"
* Orange Line: "ANN"
**Bottom Chart:**
* **Title:** Not explicitly present, but implied to be related to spikes per episode.
* **X-axis:** "number of input neurons" with markers: 4(6 x 6), 6(4 x 4), 20(2 x 2), 70(1 x 1).
* **Y-axis:** "spikes per episode" on a logarithmic scale, ranging from 10<sup>1</sup> to 10<sup>6</sup>.
* **Legend:** Located in the top-right corner.
* Green Line: "Direct training prob. SNN"
* Black Line: "ANN-to-SNN conversion"
Both charts share the same x-axis. Annotations with arrows and text "T = 8, τ<sub>2</sub> = 4" are present in both charts, pointing to specific data points. "T" likely represents a time constant and "τ<sub>2</sub>" another parameter.
### Detailed Analysis or Content Details
**Top Chart (Time-steps to reach goal):**
* **ANN (Orange Line):** Starts at approximately 2000 time-steps at 4(6x6) input neurons, decreases to approximately 200 time-steps at 6(4x4), remains relatively stable at around 150 time-steps for 20(2x2) and 70(1x1).
* **ANN-to-SNN conversion (Black Line):** Starts at approximately 3000 time-steps at 4(6x6), decreases to approximately 1000 time-steps at 6(4x4), then decreases to approximately 200 time-steps at 20(2x2), and increases slightly to approximately 300 time-steps at 70(1x1).
* **Direct training prob. SNN (Green Line):** Starts at approximately 10000 time-steps at 4(6x6), dramatically decreases to approximately 20 time-steps at 6(4x4), and remains relatively stable at around 10-20 time-steps for 20(2x2) and 70(1x1).
**Bottom Chart (Spikes per episode):**
* **ANN-to-SNN conversion (Black Line):** Starts at approximately 500000 spikes at 4(6x6), decreases to approximately 100000 spikes at 6(4x4), then decreases to approximately 30000 spikes at 20(2x2), and remains relatively stable at around 30000 spikes at 70(1x1).
* **Direct training prob. SNN (Green Line):** Starts at approximately 100 spikes at 4(6x6), decreases to approximately 20 spikes at 6(4x4), and remains relatively stable at around 10-20 spikes for 20(2x2) and 70(1x1).
The annotation "T = 8, τ<sub>2</sub> = 4" points to a data point on both charts. On the top chart, it corresponds to approximately 20 time-steps for the green line at 6(4x4) input neurons. On the bottom chart, it corresponds to approximately 20 spikes for the green line at 6(4x4) input neurons.
### Key Observations
* The "Direct training prob. SNN" method consistently achieves the lowest time-steps to reach the goal, especially as the number of input neurons increases.
* The "ANN-to-SNN conversion" method performs better than the ANN in terms of time-steps to reach the goal for 4 and 6 input neurons, but the performance converges as the number of input neurons increases.
* The "Direct training prob. SNN" method exhibits the lowest spike count per episode across all input neuron configurations.
* Both metrics (time-steps and spikes) show a significant improvement when moving from 4(6x6) to 6(4x4) input neurons for all methods.
* Increasing the number of input neurons beyond 6(4x4) yields diminishing returns in performance improvement.
### Interpretation
The data suggests that direct training of probabilistic SNNs is a more efficient approach than ANN-to-SNN conversion and standard ANNs, particularly in terms of both speed (time-steps to reach goal) and energy efficiency (spikes per episode). The dramatic reduction in both metrics when transitioning from 4(6x6) to 6(4x4) input neurons indicates a critical threshold in network capacity. The stabilization of performance beyond 6(4x4) suggests that further increasing the network size does not provide substantial benefits.
The annotation "T = 8, τ<sub>2</sub> = 4" likely represents specific hyperparameters used in the direct training method, highlighting a configuration that achieves optimal performance at 6(4x4) input neurons. The consistent low spike count of the direct training method suggests that it is able to represent information more sparsely, leading to lower power consumption. The convergence of the ANN and ANN-to-SNN conversion methods at higher input neuron counts suggests that the benefits of SNNs become less pronounced as network complexity increases. This could be due to the limitations of the ANN-to-SNN conversion process in fully capturing the dynamics of spiking neurons.