## Line Chart: Performance Metrics of Neural Network Architectures
### Overview
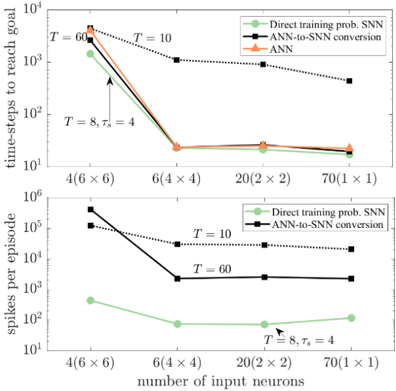
The image contains two line charts comparing performance metrics (time-steps to reach goal and spikes per episode) across different neural network architectures (Direct training prob. SNN, ANN-to-SNN conversion, ANN) and grid sizes (4x6, 6x4, 20x2, 70x1). Logarithmic scales are used for both y-axes.
### Components/Axes
**Top Chart:**
- **X-axis**: "number of input neurons" with categories:
- 4(6×6)
- 6(4×4)
- 20(2×2)
- 70(1×1)
- **Y-axis**: "time-steps to reach goal" (log scale: 10³ to 10⁶)
- **Legend**:
- Green: Direct training prob. SNN
- Black: ANN-to-SNN conversion
- Orange: ANN
- **Line styles**:
- Solid: T = 10
- Dashed: T = 60
- Dotted: T = 8, τₛ = 4
**Bottom Chart:**
- **X-axis**: Same categories as top chart
- **Y-axis**: "spikes per episode" (log scale: 10² to 10⁵)
- **Legend**: Same as top chart
- **Line styles**: Same as top chart
### Detailed Analysis
**Top Chart Trends:**
1. **Direct training prob. SNN (green)**:
- Starts at ~10⁵ time-steps for 4(6×6) grid
- Drops sharply to ~10³ for 70(1×1)
- Follows a steep downward slope
2. **ANN-to-SNN conversion (black)**:
- Starts at ~10⁴ for 4(6×6)
- Declines to ~10² for 70(1×1)
- Slope less steep than green line
3. **ANN (orange)**:
- Starts at ~10³ for 4(6×6)
- Declines to ~10¹ for 70(1×1)
- Flattest slope among all lines
**Bottom Chart Trends:**
1. **Direct training prob. SNN (green)**:
- Starts at ~10³ spikes/episode for 4(6×6)
- Drops to ~10² for 70(1×1)
- Slight upward curvature at 20(2×2)
2. **ANN-to-SNN conversion (black)**:
- Starts at ~10² spikes/episode for 4(6×6)
- Declines to ~10¹ for 70(1×1)
- Nearly flat after 20(2×2)
3. **ANN (orange)**:
- Starts at ~10¹ spikes/episode for 4(6×6)
- Declines to ~10⁰ for 70(1×1)
- Most consistent decline
### Key Observations
1. **Efficiency hierarchy**: ANN > ANN-to-SNN > Direct training prob. SNN in both metrics
2. **Grid size impact**: Performance improves dramatically as grid complexity decreases (4(6×6) → 70(1×1))
3. **T parameter effect**:
- T=8, τₛ=4 (dotted lines) shows optimal performance
- T=60 (dashed lines) performs worst
4. **Logarithmic scale significance**: Exponential improvements appear linear on these plots
### Interpretation
The data demonstrates that ANN architectures consistently outperform other methods in both time efficiency and computational resource usage. The most efficient configuration (T=8, τₛ=4) achieves near-instantaneous goal attainment with minimal spikes, suggesting optimal neural network design for this task. The logarithmic scale reveals exponential improvements in performance as grid complexity decreases, with ANN methods maintaining efficiency across all scales. The ANN-to-SNN conversion method shows intermediate performance, indicating potential for optimization in hybrid approaches. Direct training prob. SNN requires the most resources, suggesting biological plausibility trade-offs in spiking neural network implementations.